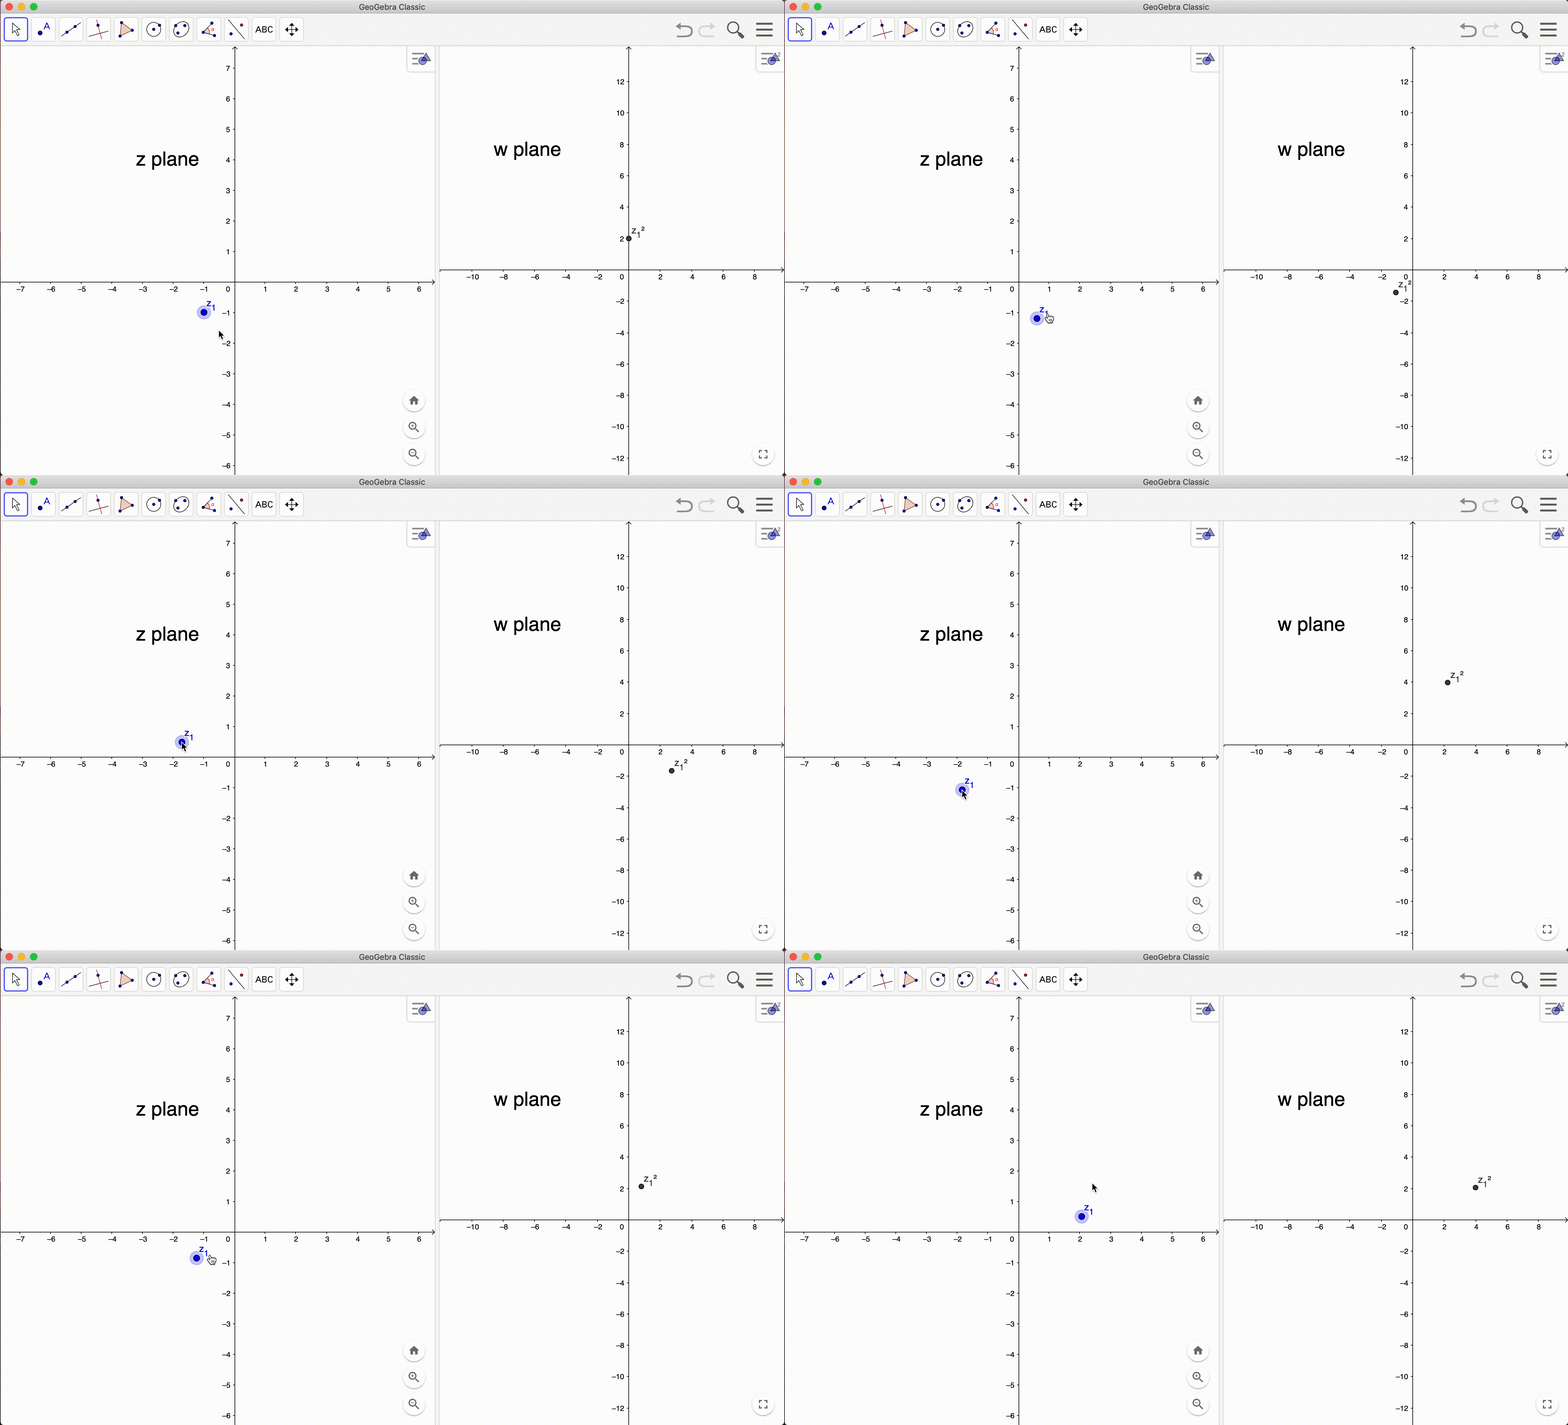
I want to replicate a nice thing I used to work with in GeoGebra.
GeoGebra has two Graphics views. One is called "Graphics", and the other "Graphics 2". The user creates geometric objects (such as lines and dots), and decides where to view them, either in "Graphics" pane, or "Graphics 2" pane.
As you can see in the gif animation below, I defined the (complex) point z_1, and defined the complex point w_1=(z_1)^2.

Obviously w_1 has different units than z_1, so it must be plotted in a different 2D plot.
It works quite good, but it has its limitations.
I want to replicate this in Mathematica, on purpose of studying complex analysis. How can I do that?
The furthest I came is to generate a GraphicsRow, which its first element is
Manipulate[
 Graphics[{{Point[z1]}}, PlotRange -> 2, Frame -> True]
 , {{z1, {1, 0}}, Locator}]
But I have no information about the real and imaginary parts of z1, to be (later) squared and plotted in the second row of GraphicsRow.
Any help would be much appreciated.