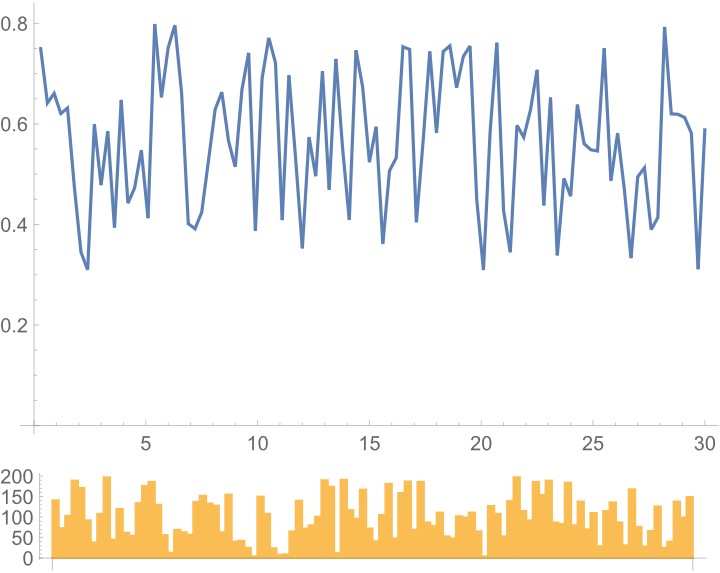
I have some data that I need to draw ListLinePlot and BarChart separately and then combine them. My question is how to combine and align the horizontal axis correctly.
data = Table[{RandomInteger[{1, 200}], RandomReal[{0.3, 0.8}], i}, {i,
     0.3, 30, 0.3}];
Column[{ListLinePlot[data[[All, {3, 2}]], PlotRange -> All,
   ImageSize -> Medium],
  BarChart[data[[All, 1]], ImageSize -> Medium, AspectRatio -> 1/8]},
 Alignment -> Center]