I want to create the following 3D plot which consists of theses lines:
Show[{
  ParametricPlot3D[
   {r Cos[t], r Sin[t], 0}, {t, 0, 2 \[Pi]}, {r, 0.9, 0.9 + 0.1},
   PlotStyle -> Lighter[Red, 1], Mesh -> None]
  ,
  ParametricPlot3D[
   {r Cos[t], r Sin[t], 0}, {t, 0, 2 \[Pi]}, {r, 0.8, 0.8 + 0.1},
   PlotStyle -> Lighter[Red, 0.8], Mesh -> None]
  ,
  ParametricPlot3D[
   {r Cos[t], r Sin[t], 0}, {t, 0, 2 \[Pi]}, {r, 0.7, 0.7 + 0.1},
   PlotStyle -> Lighter[Red, 0.6], Mesh -> None]
  ,
  ParametricPlot3D[
   {r Cos[t], r Sin[t], 0}, {t, 0, 2 \[Pi]}, {r, 0.6, 0.6 + 0.1},
   PlotStyle -> Lighter[Red, 0.4], Mesh -> None]
  }]
Output:
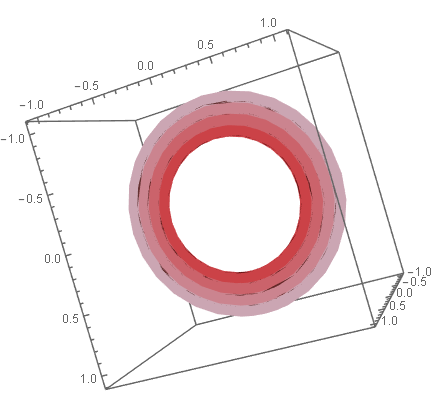
That is - a collection of annulus with radii i to i+0.1, with a color gradient toward the center.
I want to have control over the i's, the 0.1 incerment, and the Lighter[Red, ___] filling.
I was thinking about something like the following:
Show[Table[
ParametricPlot3D[{r Cos[t], r Sin[t], 0}, {t, 0, 2 \[Pi]}, {r, i, i + 0.1},
 PlotStyle -> Lighter[Red, j], Mesh -> None],
{i,0,1,0.1},{j,1,0,-0.1}]]
Which means a table of annulus with radius (0 to 0.1), (0.1 to 0.2), (0.2 to 0.3) and so on until (0.9 to 1),
filled in colors Lighter[Red,1], Lighter[Red,0.9], Lighter[Red,8]and so on until Lighter[Red,0] (fully red).
But this rather gives a nested list. I want to list to be as it is in the minimal working example.
I hope I am clear..
Thanks a lot!


