Apparently, this is not possible.... ? I have also tried to create a variable with the result of the simulation
var = sim1["volume_1.a.p", t]
And plot it in log with
LogPlot[var, {t, 0, 3}]
But the result is bad, probably because of the limits of the interpolation accuracy that becomes very bad when plotted in log scale ....
Thanks for an idea ....
Thanks for your confirmation. I can stop searching.
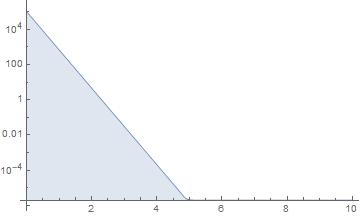
... I thik I've found a way to do it :
sim1 = SystemModelSimulate[...,3]
f = sim1[{"volume_1.a.p"}][[1]];
LogPlot[f[t], {t, 0, 10}, PlotRange -> All, Filling -> Axis]
It is not direct, but seems to work ...
Hi Abbe,
Yes, that is the recommended way of doing it.