Dear friends,
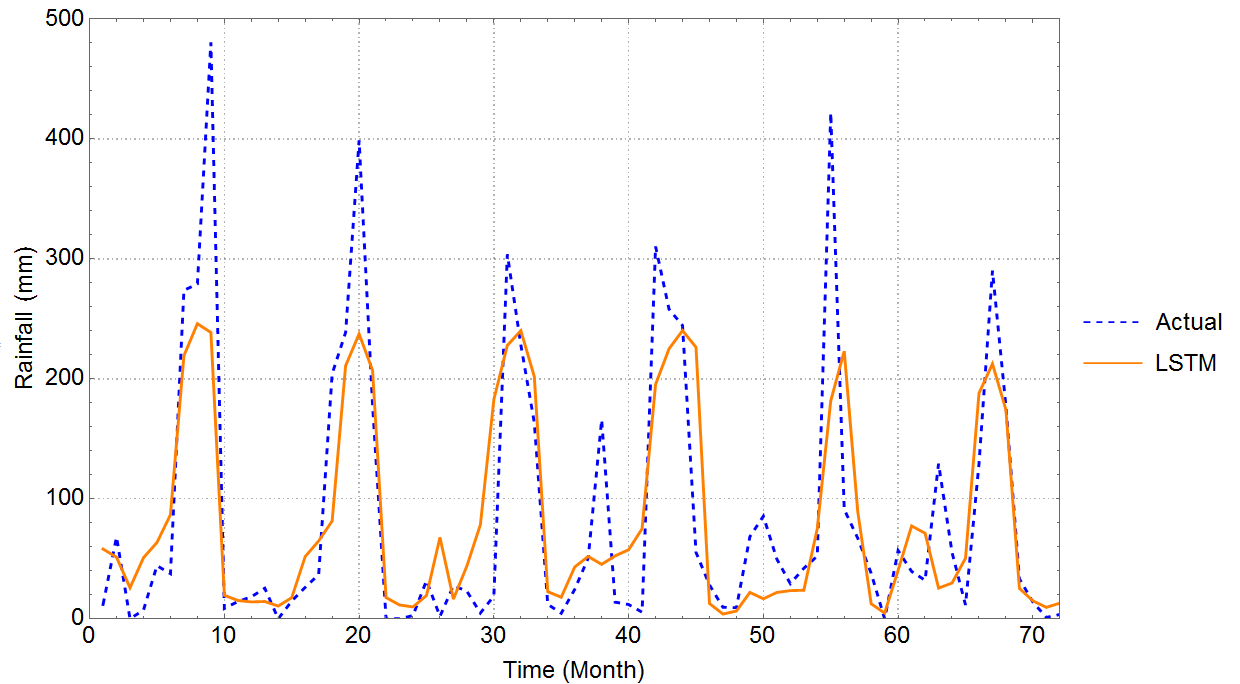
Is there any way so that the LSTM model estimates(reaches) the peak points? I really appreciate your time.
data = {1.6`, 51.3`, 26.5`, 57.8`, 69.3`, 168.1`, 473.336`, 211.847`,
   205.105`, 32.3`, 17.3`, 72.6`, 14.3`, 54.5`, 10.1`, 17.4`, 112.7`,
   12.811`, 85.494`, 171.5`, 89.1`, 30.7`, 0.`, 20.1`, 7.3`, 30.862`,
   118.2`, 9.2`, 63.8`, 127.2`, 300.9`, 315.`, 122.777`, 1.288`, 0.`,
   36.3`, 76.1`, 9.3`, 28.4`, 4.2`, 59.7`, 178.7`, 250.8`, 268.174`,
   122.5`, 10.2`, 14.`, 7.4`, 0.`, 173.1`, 63.1`, 22.9`, 85.9`,
   110.1`, 356.`, 181.9`, 175.5`, 9.3`, 11.017`, 98.7`, 17.`, 44.3`,
   64.`, 15.6`, 18.9`, 65.3`, 100.8`, 315.5`, 77.1`, 0.`, 11.3`,
   56.2`, 31.924`, 42.288`, 15.753`, 9.154`, 32.3`, 107.226`, 191.8`,
   159.9`, 94.74`, 20.476`, 23.706`, 0.`, 20.408`, 12.145`, 30.166`,
   9.831`, 40.878`, 279.147`, 313.894`, 110.407`, 286.091`, 0.354`,
   0.`, 0.002`, 4.14`, 2.619`, 28.296`, 12.792`, 40.323`, 86.26`,
   361.611`, 345.518`, 70.547`, 0.561`, 0.`, 0.942`, 38.65`, 43.903`,
   66.295`, 14.932`, 5.092`, 107.632`, 274.101`, 466.981`, 270.298`,
   0.836`, 16.807`, 2.382`, 80.2`, 75.6`, 20.`, 29.8`, 2.4`, 141.5`,
   119.1`, 265.7`, 67.`, 32.1`, 0.`, 0.`, 14.3`, 0.`, 15.5`, 124.3`,
   55.`, 292.3`, 191.6`, 0.`, 0.`, 0.`, 0.`, 0.`, 0.`, 31.`, 96.1`,
   96.`, 129.5`, 168.9`, 337.7`, 427.2`, 149.6`, 0.`, 0.`, 0.`, 54.3`,
    0.`, 0.`, 0.`, 73.9`, 123.6`, 241.`, 226.6`, 235.1`, 38.4`, 0.`,
   29.8`, 54.5`, 73.`, 50.`, 0.`, 123.1`, 405.9`, 206.7`, 328.`,
   115.`, 0.`, 12.`, 0.`, 3.`, 31.5`, 24.6`, 31.8`, 106.`, 100.`,
   143.`, 191.`, 25.`, 3.`, 0.`, 2.`, 71.`, 93.8`, 33.`, 29.`, 3.802`,
    106.`, 92.`, 256.7`, 192.3`, 42.`, 0.`, 0.`, 72.`, 236.`, 108.`,
   43.`, 15.`, 110.`, 151.`, 218.3`, 163.`, 0.`, 7.`, 45.`, 58.`, 5.`,
    0.`, 81.3`, 63.`, 167.`, 227.`, 354.3`, 150.4`, 38.`, 3.`, 0.`,
   79.`, 34.`, 17.9`, 0.`, 15.`, 35.`, 433.4`, 79.7`, 217.1`, 11.`,
   0.`, 0.`, 5.1`, 1.8`, 41.6`, 21.3`, 115.6`, 112.7`, 267.2`, 276.1`,
    55.5`, 3.2`, 0.`, 5.3`, 3.`, 114.`, 127.`, 12.`, 45.`, 192.4`,
   171.2`, 226.2`, 245.4`, 4.`, 0.`, 0.`, 0.`, 0.`, 0.`, 0.`, 0.`,
   10.2`, 256.9`, 206.9`, 144.6`, 0.`, 10.`, 7.`, 3.`, 0.`, 19.`,
   40.`, 52.`, 13.3`, 142.2`, 199.`, 166.9`, 16.`, 10.9`, 0.`, 12.`,
   68.2`, 0.`, 7.3`, 44.3`, 37.6`, 273.9`, 279.2`, 480.6`, 8.6`,
   14.4`, 18.3`, 25.5`, 0.`, 14.8`, 26.2`, 36.9`, 204.3`, 238.8`,
   399.`, 178.1`, 0.1`, 0.`, 2.7`, 31.9`, 2.`, 27.6`, 23.`, 4.8`,
   19.`, 304.`, 228.5`, 163.7`, 12.1`, 4.6`, 24.5`, 50.6`, 166.`,
   13.9`, 11.9`, 5.5`, 310.5`, 258.1`, 244.6`, 55.4`, 28.2`, 9.6`,
   9.3`, 68.5`, 85.6`, 49.7`, 29.3`, 42.1`, 52.3`, 421.9`, 91.2`,
   67.3`, 37.9`, 0.`, 56.9`, 39.5`, 32.1`, 129.4`, 55.3`, 11.5`,
   129.2`, 290.3`, 177.1`, 33.4`, 14.`, 1.1`, 3.6`};

(*LSTM model*)

window = 24;

test = Take[data, -96];

train = Take[data, {1, Length[data] - 96}];

testWind =
  List /@ Most[#] -> List@Last[#] & /@ (Partition[test, window + 1,
     1]);

trainWind =
  RandomSample[
   List /@ Most[#] -> List@Last[#] & /@ (Partition[train, window + 1,
      1])];

net = NetChain[{LongShortTermMemoryLayer[20], LinearLayer[1]},
  "Input" -> {window, 1}, "Output" -> 1]

trained =
 NetTrain[net, trainWind, ValidationSet -> testWind, BatchSize -> 64]

(*Training values*)

ptrain = Map[trained[#] &, trainWind // Keys] // Flatten;

realtrain = trainWind // Values // Flatten;

(*Testing values*)

ptest = Map[trained[#] &, testWind // Keys] // Flatten;

realtest = testWind // Values // Flatten;

(*Actual vs. Predicted*)

ListLinePlot[{realtest, ptest}, LabelStyle -> {16, GrayLevel[0]},
 PlotLegends -> {"Actual", "LSTM"},
 FrameLabel -> {"Time (Month)", "Rainfall (mm)"},
 PlotTheme -> "Detailed",
 PlotStyle -> {{Blue, Dashed, Thickness[.003]}, {Orange,
    Thickness[.003]}}, AxesLabel -> {"Time", "Actual"},
 ImageSize -> 700, PlotRange -> {{0, 72}, {0, 500}}]