Group Abstract Group Abstract

Message Boards Message Boards

0
|
2.4K Views
|
2 Replies
|
1 Total Like
View groups...
Share
Share this post:

Help in 3D plot for a piecewise function?

I want to plot a piecewise function but my 3dplot doesn't work well, someone know where is the error on my code?

POSTED BY: Rubens Quirino
2 Replies

Yes, that's it! thank you

POSTED BY: Rubens Quirino
Posted 4 years ago

Hi Rubens,

The predicate x < -10 && x > 10 (and similarly for y) is never True. Perhaps you meant to use ||?
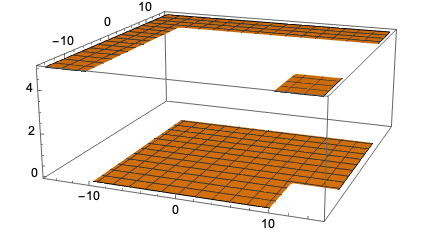
V[x_, y_] := 
 Piecewise[{
  {5, x < -10 || x > 10 && y < -8 || y > 8}, 
  {0, x >= -10 || x <= 10 && y <= 8 || y >= -8}}]

Plot3D[V[x, y], {x, -15, 15}, {y, -15, 15}]

enter image description here

POSTED BY: Rohit Namjoshi
Reply to this discussion
Community posts can be styled and formatted using the Markdown syntax.
Reply Preview
Attachments
Remove
or Discard