Message Boards Message Boards

0
|
4091 Views
|
2 Replies
|
0 Total Likes
View groups...
Share
Share this post:

Identifying regular intervals in athlete sports performance data?

Posted 3 years ago

I am working on an application which will analyse sports performance data (in this case, second-by-second power output data from training cyclists). I need to be able to look at a time series of power data and identify when the athlete was doing interval training (which may only occur during a subset of the session data -- or not at all), with the definition of "interval training" implying alternating periods of high and low power intensity. And I need to separate those intervals out for analysis. The problem is, the data is not so much noisy as irregular. Here is a picture of a plot.... enter image description here

In this example, only the 3 obvious blocks would qualify as sets containing 8, 7 and 6 intervals, respectively. I have looked at moving averages, and attempted to identify intervals via steep changes in slope. To be clear, I am not asking for a step-by-step solution (although that would be great); just a strategy as to how to achieve this in Mathematica.

Thanks in advance for any pointers.

Brad

POSTED BY: Brad Varey
2 Replies
Posted 3 years ago

HI Henrik Thank you very much for your prompt reply. I enclose a workbook with my data and a couple of attempts to apply ShortTimeFourier[] to it....

To be honest, I wasn't able to make much sense of the output. I will do some further research into the concepts and techniques you've suggested.

As far as Bourg Saint Maurice and biking are concerned, my application is more focused on endurance road cycling. But you are right, the mountain biking here is really excellent.

Good health.

Brad

POSTED BY: Brad Varey

Brad,

unfortunately you did not give any sample data, so I can only guess making something up. Maybe ShortTimeFourier would be one way to go. Here is my simple attempt:

f[x_] := Piecewise[{{SquareWave[{0.5, 1}, x], (3 < x < 8) || (19 < x < 23)}, {1, 11 < x < 16}}, .5];
data = Table[f[x], {x, 0, 25, .005}];
(* "power data" *)
ListLinePlot[data]
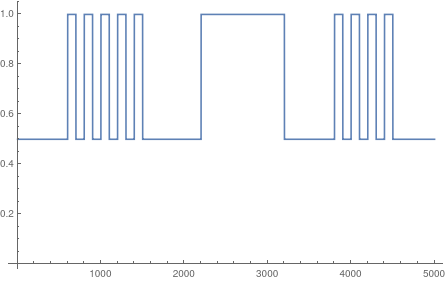
enter image description here

stf = ShortTimeFourier[data];
MatrixPlot[Transpose[SpectrogramArray[data]], AspectRatio -> 1/3]
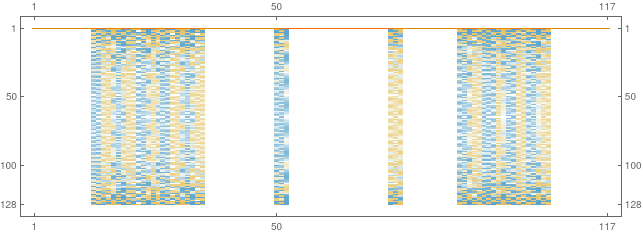
enter image description here

Does that help? Regards -- Henrik

Addendum: I already have been in Bourg Saint Maurice, France - it is definitely a great place for biking in the mountains! We liked it a lot!

POSTED BY: Henrik Schachner
Reply to this discussion
Community posts can be styled and formatted using the Markdown syntax.
Reply Preview
Attachments
Remove
or Discard

Group Abstract Group Abstract