Brad,
unfortunately you did not give any sample data, so I can only guess making something up. Maybe ShortTimeFourier would be one way to go. Here is my simple attempt:
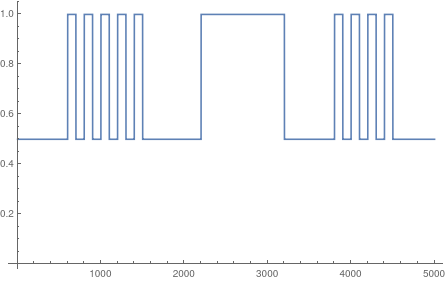
f[x_] := Piecewise[{{SquareWave[{0.5, 1}, x], (3 < x < 8) || (19 < x < 23)}, {1, 11 < x < 16}}, .5];
data = Table[f[x], {x, 0, 25, .005}];
(* "power data" *)
ListLinePlot[data]
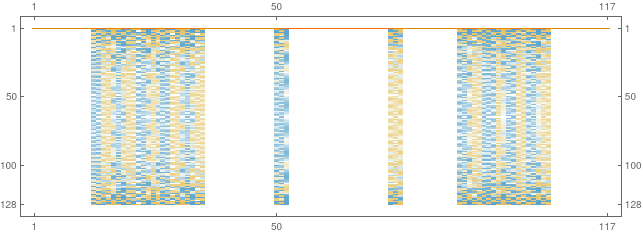
stf = ShortTimeFourier[data];
MatrixPlot[Transpose[SpectrogramArray[data]], AspectRatio -> 1/3]
Does that help? Regards -- Henrik
Addendum: I already have been in Bourg Saint Maurice, France - it is definitely a great place for biking in the mountains! We liked it a lot!


