Message Boards Message Boards

How to include the origin of a dot plot ?

Posted 3 years ago

I need to plot data as points on a graph but the graph I get does not include the origin of the x-axis. I have a problem with visibility.enter image description here

2 Replies

Use AxesOrigin option for the plot.

Like:

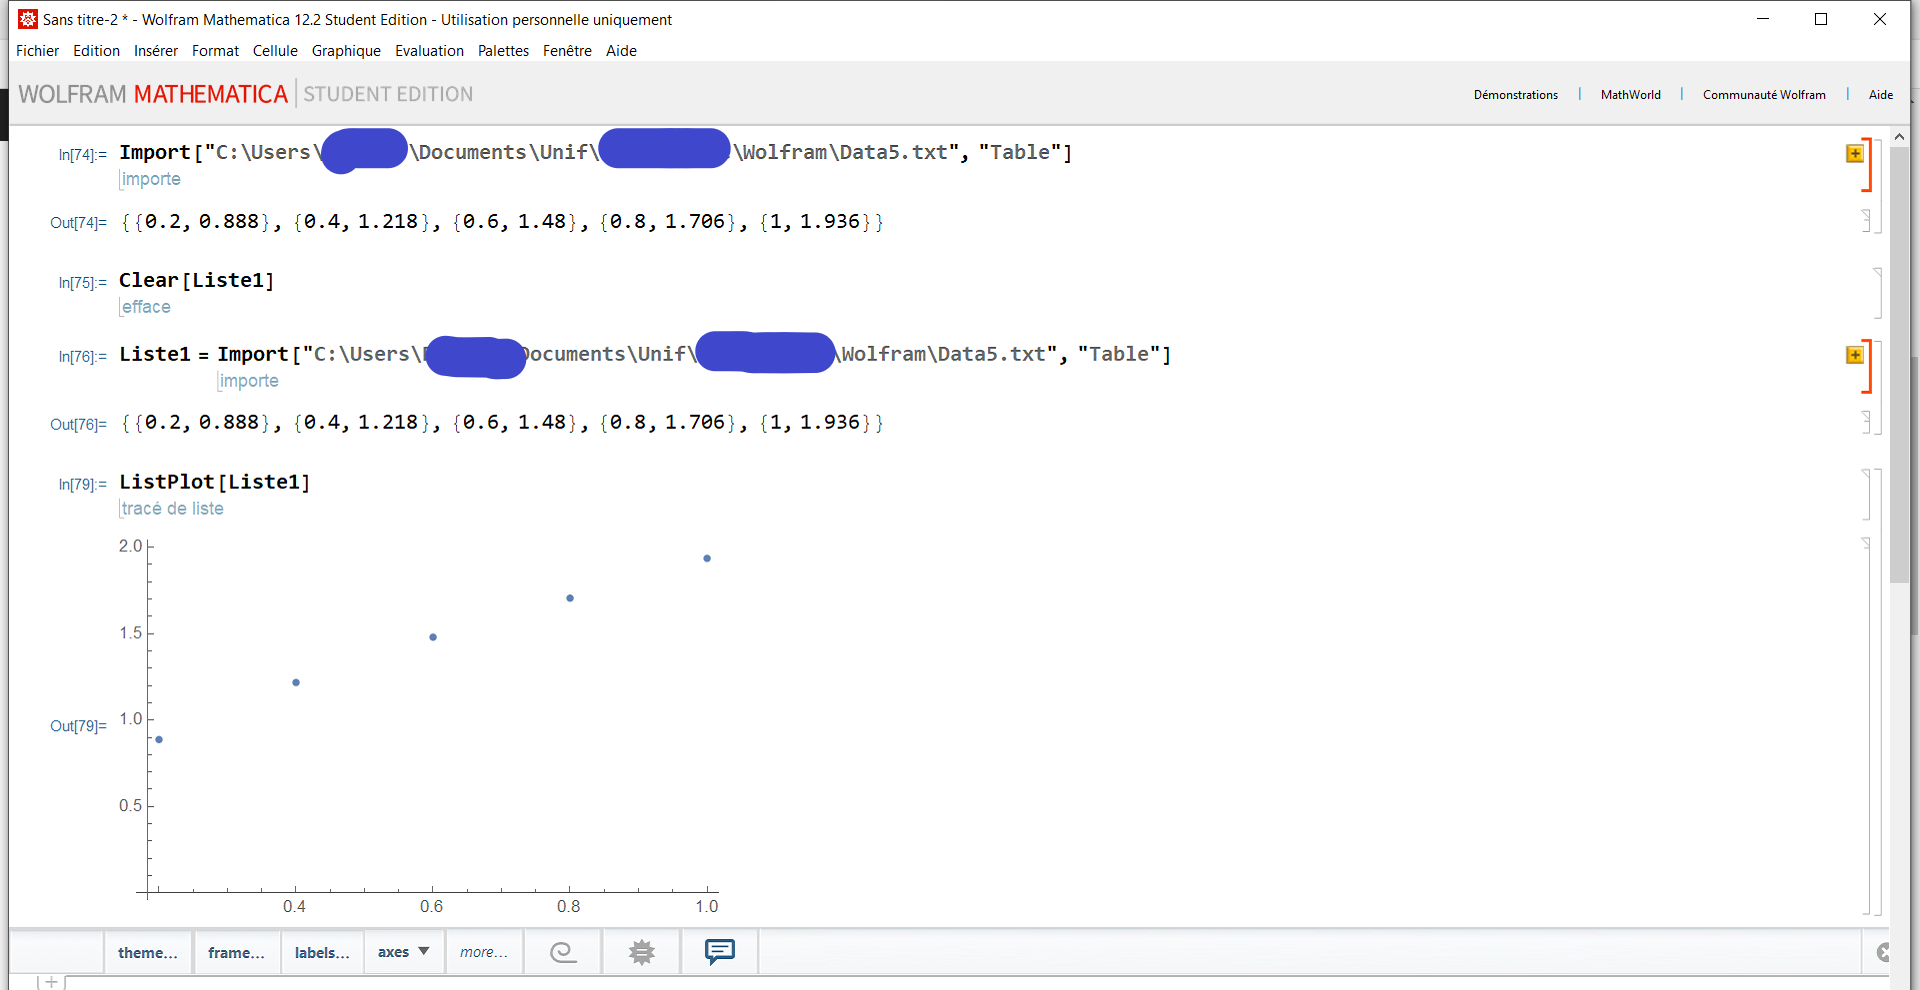
ListPlot[Liste1, AxesOrigin->{0,0}]

Thank you a lot!

Reply to this discussion
Community posts can be styled and formatted using the Markdown syntax.
Reply Preview
Attachments
Remove
or Discard

Group Abstract Group Abstract