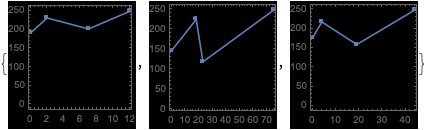
The full range of the data is plotted, it is the origin that is different. Is this what you are looking for?
plots = ListLinePlot[#,
   Background -> Black,
   ImageSize -> {128, 128},
   Frame -> True,
   Axes -> False,
   AspectRatio -> 1,
   PlotRange -> All,
   AxesOrigin -> {0, 0},
   PlotMarkers -> {{\[FilledCircle], 2}}] & /@ images
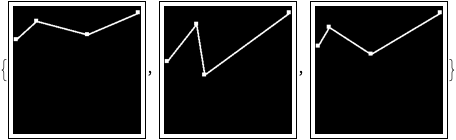
Regarding Binarize, it requires an Image or Graphics as input. Framed changes the Head to Framed. So, Binarize first, then add Framed.
plots = ListLinePlot[#,
    Background -> Black,
    ImageSize -> {128, 128},
    Frame -> False,
    Axes -> False,
    AspectRatio -> 1,
    PlotRange -> All,
    AxesOrigin -> {0, 0},
    PlotMarkers -> {{\[FilledCircle], 2}}] & /@ images

Binarize /* Framed /@ plots