TradingChart is a composite of two Graphics. Looks like Epilog is added to the second one (volume chart) and Prolog is added to the first one.
scaledPath = MapAt[2*10^5 # &, currentPath, {All, 2}];
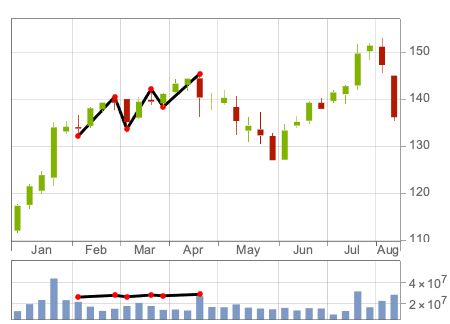
TradingChart[data[[1 ;; 32]],
Epilog -> {Thickness[0.0075], Black, Line[scaledPath], PointSize[Medium], Red, Point[scaledPath]},
Prolog -> {Thickness[0.0075], Black, Line[currentPath], PointSize[Medium], Red, Point[currentPath]}]