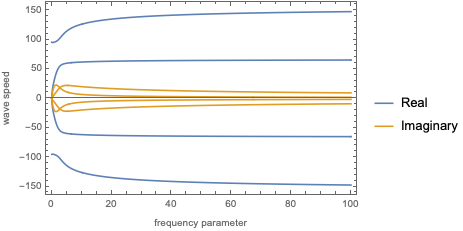
Hi, I try to plot wave speed which is a function of frequency [omega] and its have 4 solutions with imaginary parts. I have to plot my program in the x-axis is frequency parameter [[CapitalOmega]] and y-axis in real and imaginary wave speed. We assume that the imaginary line will be shown, its decrease and real will increase, but I could not figure out the result. Please help me how can I Plot wave speed as a function of omega. I attached my program here where c1 is the wave speed.
Hi Md,
The problem is that ω is assigned a specific value so the solution does not depend on ω, so straight lines are plotted.
Comment out ω = 2 π fp; then evaluate ClearAll[Evaluate[Context[] <> "*"]]. Then evaluate all the cells
ClearAll[Evaluate[Context[] <> "*"]]
Dear Rohit
Thank you very much for your reply. I am not familiar with Mathematica so can you add your edit program where you find this figure. I hope it`s helpful for me. Please add the editing program so that I can understand what change I need.
Dear Rohit, I can plot now. Thank you very much for your help. One more thing please tell me how can I plot positive two-waves in one figure and other negative two-waves in another figure. That means how can I plot positive and negative wave speed in a separate graph. Please help me.
See the attached notebook.
Thank you very very much for your help. I am very happy to see my required result. Take care and be happy.