I have a problem with density plots. I have 4 classes, 0 to 3, that I want to assign fixed colours. My problem is, that if one of the classes, eg class 0, is missing in the data, this messes up the colouring scheme, as data belonging to class 1 will take the colour of class 0, etc..
Here's code to reproduce this problem:
data1 = Table[{RandomReal[{0, 10}], RandomReal[{0, 5}],
  RandomChoice[{0, 1, 2, 3}]}, 100];
data2 = Table[{RandomReal[{0, 10}], RandomReal[{0, 5}],
  RandomChoice[{1, 2, 3}]}, 100];

mylegend =
  PointLegend[{
   RGBColor[0.237736, 0.340215, 0.575113],
   RGBColor[0.277947,0.45009699999999997`,0.32815550000000004`],
   RGBColor[0.72987, 0.239399, 0.230961],
   RGBColor[0.8562609999999999, 0.742794, 0.31908333333333333`]},
  {"Class 0", "Class 1", "Class 2", "Class 3"}, LegendMarkerSize -> 20];

ListDensityPlot[data1, InterpolationOrder -> 0, PlotLegends -> mylegend,
  ColorFunction -> "DarkRainbow", FrameLabel -> {x, y},
  LabelStyle -> Large, RotateLabel -> False]
ListDensityPlot[data2, InterpolationOrder -> 0, PlotLegends -> mylegend,
  ColorFunction -> "DarkRainbow", FrameLabel -> {x, y},
  LabelStyle -> Large, RotateLabel -> False]
Here are results that this code may produce: 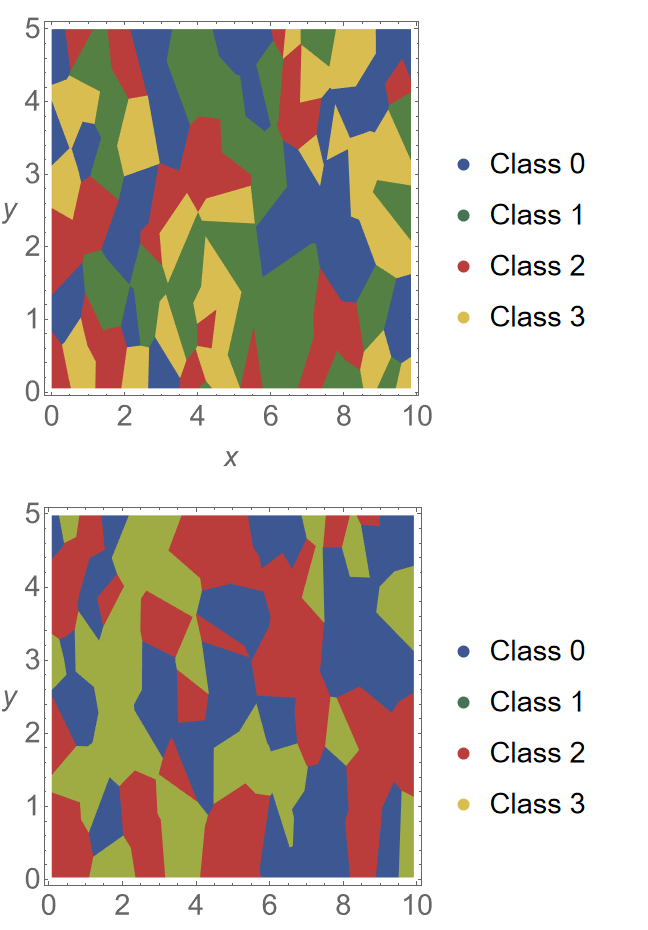
 Attachments:


