I made a convolution of two functions. The convolution graph is safely displayed as a graph. But how do I get the numerical value of this convolution. To make an array of samples.
Is this what you are looking for?
tbl=Table[conv,{y,Pi/16,2Pi,Pi/16}]//N
If that doesn't produce exactly what you are looking for then please edit your post to show exactly what the result should be and I'll see if I can match that.
It works! Many thanks, Bill.
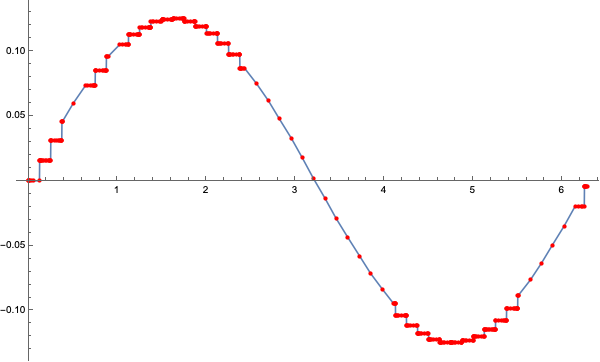
If you want to extract the points that were actually used by Plot
Plot
plot = Plot[conv, {y, 0, 2*Pi}, PlotRange -> All];
points = Cases[plot, Line[p__] :> p, All];

Show[plot, ListPlot[points, PlotStyle -> Red], ImageSize -> 600]