Developing better tools for molecular analysis – Fighting spread of the virus
See full 3d video of COVID-19 3d Microscopy simulation COVID-19 3d Microscopy Detailed closeup video
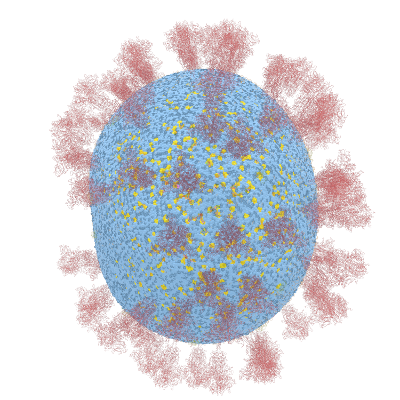
Below documentation for the objects and their colors in the 3d visualization.
- A = Green dot
- C = Dark Yellow dot in middle section
- CTD = Red dot
- E = Yellow ribbon object
- G = Yellow dot
- M = Orange ribbon object
- NTD = Dark Red dot in middle section
- P = Dark Blue dot
- S = Red ribbon object as Spike shape
- U = Purple dot
See full 3d video of COVID-19 3d Microscopy simulation
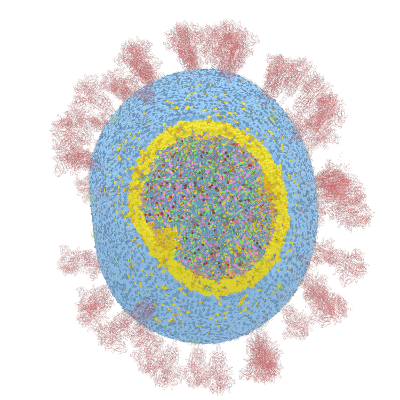
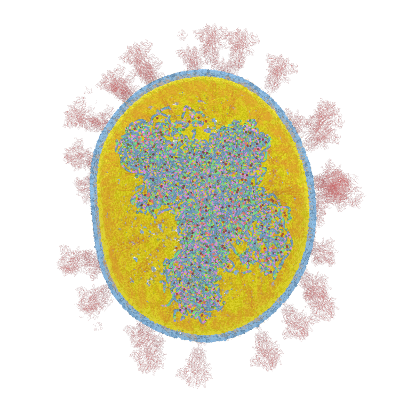
Below documentation for the objects and their colors in the 3d visualization.
- A = Green dot
- C = Dark Yellow dot in middle section
- CRYSTALL_ CUT_SINGLE = Yellow dot inside outer layer
- CRYSTALL_ CUT_SINGLE2 = Blue dot outside outer layer
- CTD = Red dot
- E = Yellow ribbon object
- FLUID_ CUT_SINGLE = Dark yellow dot inside outer layer
- FLUID_ CUT_SINGLE2 = Dark blue dot outside outer layer
- G = Yellow dot
- M = Orange ribbon object
- NTD = Dark Red dot in middle section
- P = Dark Blue dot
- S = Red ribbon object as Spike shape
- U = Purple dot
Wolfram Research has released lots of data for COVID-19 analysis. After examining the data we have come up with novel ways for new 3d visualizations from the data to help researchers in analyzing and visualizing the data.
Visualize the molecular data by simulating the microscopy layers as an animation. With this visualization it's possible to take very close-up sequences from the microscopy data and focus on certain areas and structures. You can hide certain groups easily and focus on only those areas you are interested in.
Details about the current video: Only the location data is used for the points. No translation or rotation data is used. The dots are sphere objects with a same size each. There is a custom rotation and location for the S object the spike where there is a custom distance used. Other objects M,E use the origin as the point location.
We are looking for discussions an planning on a new application based on the visualizations and companies interested in the research through. Contact us through Wolfram Community for more details.
Code
Extracting point data to a 3d file WRL file. Note that there is no edges or meshes so you can only import the data with point-cloud or compatible 3d programs. Objects have to be added to the vertex points. Original code from Jeff Bryant article in references.
structureds = CloudGet[CloudObject["https://www.wolframcloud.com/obj/eca571e5-3054-44ed-9eda-9d19a435cbfc"]];

datamatrix = Transpose[Values@Normal[structureds[All]]];

getPos[str_String] :=  Cases[datamatrix,
 {str, x_, y_, z_, yRot_, zRot_, sRotBar_, xRotBar_, _} :> {x, y, z}]

exportPoints[key_String] :=
 Export["./pointData_" <> key <> ".wrl", ListPointPlot3D[{getPos[key]}, BoxRatios -> Automatic,
 ImageSize -> 600, PlotStyle -> PointSize[.005]]];

exportPoints[#] & /@ {"A","C","CRYSTALL_CUT_SINGLE","CRYSTALL_CUT_SINGLE2","CTD","E","FLUID_CUT_SINGLE","FLUID_CUT_SINGLE2","G","M","NTD","P","S","U"};
References
Bryant Jeff. 2020. ”3D Modeling of the SARS-CoV-2 Virus in the Wolfram Language.” https://community.wolfram.com/groups/-/m/t/1989540
Nguyen, N., Strnad, O., Klein, T., Luo, D., Alharbi, R., Wonka, P., Maritan, M., Mindek, P., Autin, L., Goodsell, D. and Viola, I. 2020. "Modeling in the Time of COVID-19: Statistical and Rule-based Mesoscale Models." https://arxiv.org/abs/2005.01804


