Hello Rajanikant Metri,
I do not know how to plot something between 1 and infinity. But you can show that there are two fixpoints (where your function intersects the identiy):
func[x_] := Piecewise[{{2 x + 1, x <= 0}, {1/2 x + 2, x > 0}}];
Solve[func[x] == x, x]
(*  Out:  {{x\[Rule]-1},{x\[Rule]4}}  *)
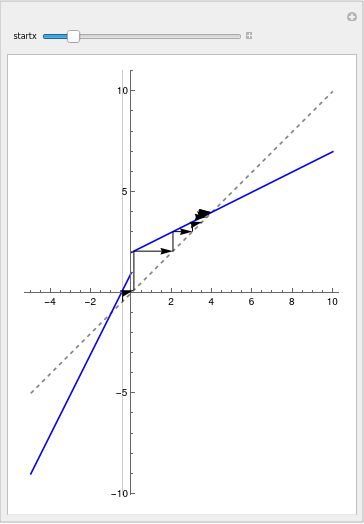
The one at x=-1 is repulsive, the other one at x=4 is attractive, and that can easily be demonstrated:
Manipulate[
 arrows = BlockMap[Arrow[{{#[[1]], #[[1]]}, #, {#[[2]], #[[2]]}}] &, NestList[func, startx, 10], 2, 1];
 Plot[{x, func[x]}, {x, -5, 10}, AspectRatio -> Automatic, Epilog -> arrows, GridLines -> {{startx}, None},
  PlotStyle -> {{Dashed, Gray}, Blue}], {{startx, 1}, -2, 10}]
Does that help?


