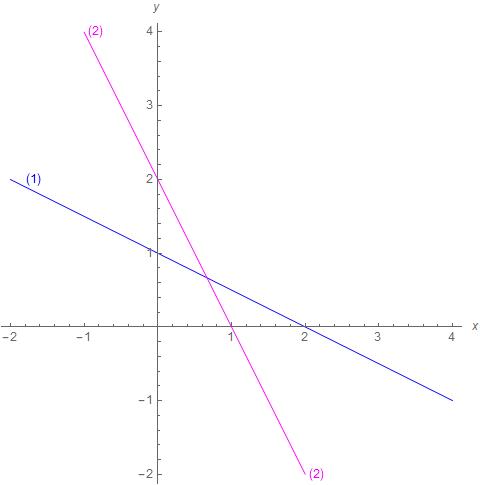
Good morning. I have two equations (or more) that I want plot with ContourPlot colored with different colours and labelled according to equation order, in a automatic way. I have tried several solutions without success. My plot should remain as
g1 = x + 2 y; g2 = 2 x + y; b = {2, 2};

coloresRest = {Blue, Magenta}; labelRest =
 Table[Text[Style["(" <> ToString@i <> ")", coloresRest[[i]]]], {i,
   Length@coloresRest}];

ContourPlot[{g1 == b[[1]], g2 == b[[2]]}, {x, -2,
  4}, {y, -2, 4}, Frame -> False, Axes -> True,
 ContourStyle -> Thread[{coloresRest, grosor}],
 Epilog -> {Text[Style["(1)", color3], Offset[{20, 0}, {-2, 2}]],
   Text[Style["(2)", color4], Offset[{-10, -10}, {-1, 4}]]},
 ImageSize -> 400]
I have tried with Table, ContourLabel, Riffle or Epilog, without success. For example:
ContourPlot[{g1 == b[[1]], g2 == b[[2]]}, {x, -2,
  4}, {y, -2, 4}, Frame -> False, Axes -> True,
 ContourStyle -> Thread[{coloresRest, grosor}],
 ContourLabels ->
  Table[Text[Style[labelRest[[i]], Offset[{10, 0}, {#1, #2} &]]], {i,
    1, Length@coloresRest}], ImageSize -> 400]
or
ContourPlot[{g1 == b[[1]], g2 == b[[2]]}, {x, -2,
  4}, {y, -2, 4}, Frame -> False, Axes -> True,
 ContourStyle -> Thread[{coloresRest, grosor}],
 ContourLabels -> {Riffle[coloresRest,
    Inset[labelRest, Offset[{10, 0}, {#1, #2} &]]]}, ImageSize -> 400]
I realize that expression {#1, #2}& yield coordinates for labels, chosen by Mathematica. I'd prefer that and not to choose such coordinates.
Thank in advance


