Good day,
I would like to ask a best practice on creating this plot: 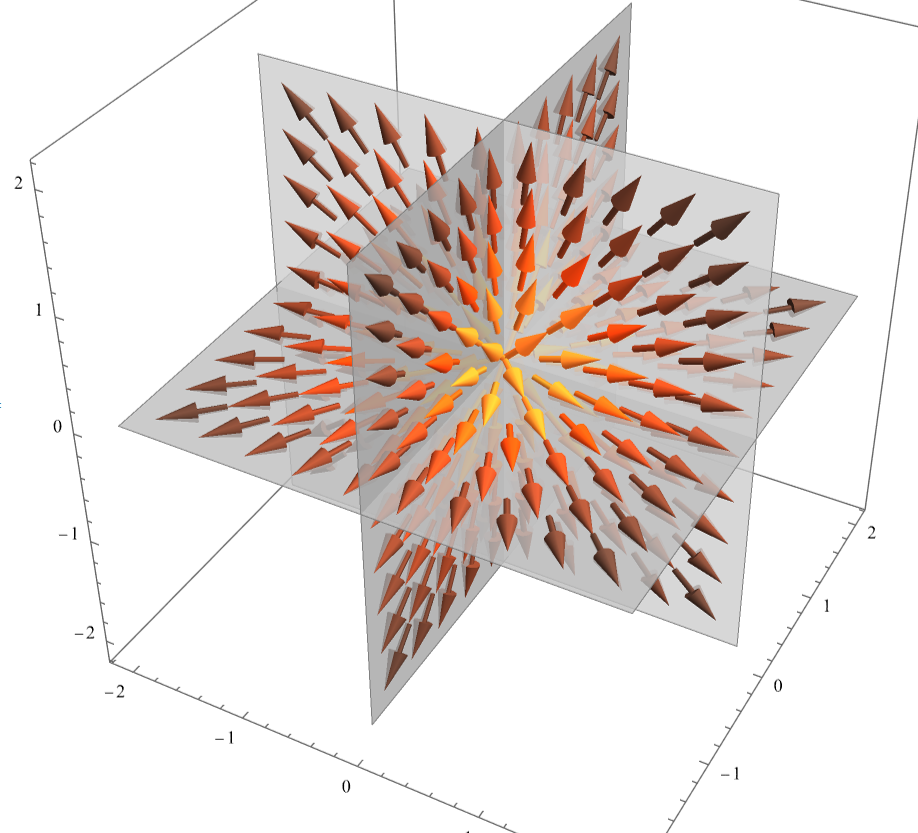
It is the representation of an electric field. Initially, when trying to plot it, it would not show any result. The initial function divides by the electric constant: 1/(4pie_0)*q/(r-p)
However, when trying to plot that, it does not show any of the vector arrows. I then tried multiplying the vector by the electric constant (such as to cancel out the electric constant), and then it works. Why would that be?
Is it because the scale didn't fit within the limits of -2,2 defined in the plot? Or another reason?
Is my second approach with multiplying by e_0 recommend? Then to just multiply the scale of the axes accordingly?
Any guidance or advice would be highly appreciated.
Kind regards, Connor


