Time to first byte (TTFB) refers to the time between the browser requesting a page and when it receives the first byte of information from the server. It may vary a lot if the content is a static asset (images, pdf, zip, style and javascript files) or a dynamic one (is computed on the fly by the web server). An example of dynamic content is the page you are reading just now, as well as almost every page of every modern website. The process of computing a page takes about 1 second or more, that's why cache were created:
Cache do save a copy of dynamic contents to serve them instantly. 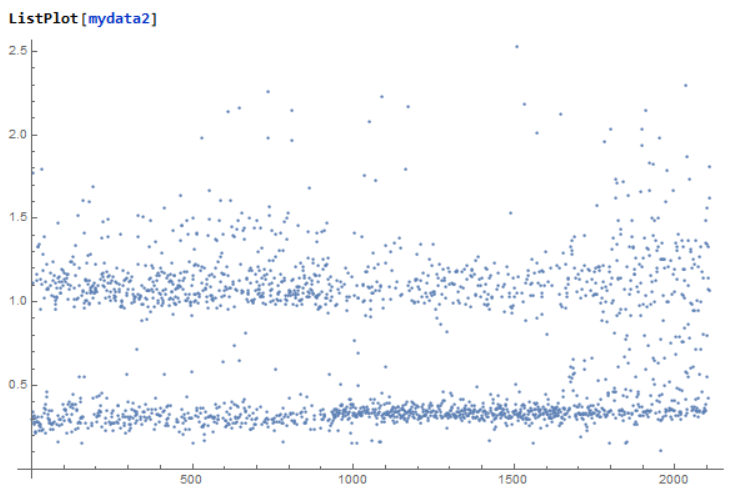
I've spidered the whole website and collected the TTFB for every page (x axis correspond to each page), the y axis reports the TTFB for that page in seconds. You can observe a strong difference between pages which were cached and pages which were rendered on the fly.
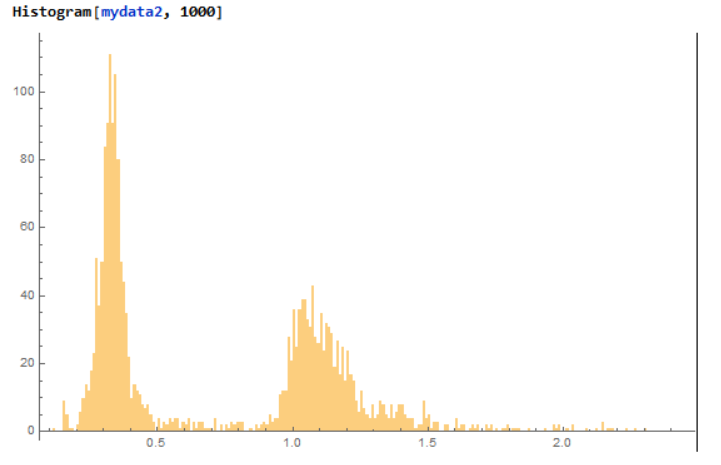
For my purpose you can consider the y axis only. I'd like to get a distribution of probability that can be easily summarized and compared with the result of a new test.
I've put the mydata here: https://www.wolframcloud.com/obj/7430bbee-8954-4a4e-b0a6-ee9fdb69c2f4
mydata2 = Rest[mydata][[All, 2]];
ListPlot[mydata2]
Histogram[mydata2, 1000]
 Attachments:


