One of the option is to use "Tooltip" command which displays the values as you hover the mouse pointer. In your case-
dataPlot =
ListLinePlot[
Tooltip[data],
PlotRange -> {{2005, 2015}, {30, 60}},
Ticks -> {Range[2006, 2013, 1] // Evaluate, Automatic},
PlotStyle -> PointSize[.02],
PlotMarkers -> {Automatic, 10},
Frame -> True,
GridLines -> Automatic,
GridLinesStyle -> Directive[Black, Dotted],
Filling -> Bottom, {FillingStyle -> Automatic},
AxesOrigin -> {2014, 55}]
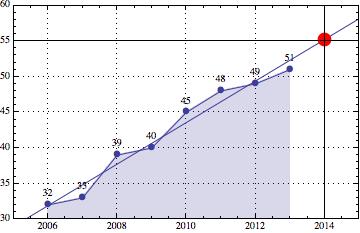
Or you can use the "Epilog" option to lable the data points as shown below:
dataPlot =
ListLinePlot[
data,
PlotRange -> {{2005, 2015}, {30, 60}},
Ticks -> {Range[2006, 2013, 1] // Evaluate, Automatic},
PlotStyle -> PointSize[.02],
PlotMarkers -> {Automatic, 10},
Frame -> True,
GridLines -> Automatic,
GridLinesStyle -> Directive[Black, Dotted],
Filling -> Bottom, {FillingStyle -> Automatic},
AxesOrigin -> {2014, 55},
Epilog -> {Text[#[[2]], # + {0, 1.5}] & /@ data}
]
And the lables will be displayed like this: