Message Boards Message Boards

0
|
4881 Views
|
5 Replies
|
1 Total Likes
View groups...
Share
Share this post:

How does one deal with missing data in FinancialData?

Posted 2 years ago

So close, so close, but missing data shuts down Mathematica's functions. My data, the first sector -- AdvertisingAgencies -- for example, 133 stocks, when filtered for nyse & nasdaq a mere 33. Problems with missing data so filtered again for 2021 at 193 days, and eight more bit the dust. The list:

secNN01y = {"NASDAQ:ADV", "NASDAQ:BOMN", "NASDAQ:CMPR", "NASDAQ:CNET", \
"NASDAQ:CRTO", "NASDAQ:FLNT", "NASDAQ:ICLK", "NASDAQ:ISIG", \
"NASDAQ:MCHX", "NASDAQ:MGNI", "NASDAQ:NCMI", "NASDAQ:QNST", \
"NASDAQ:SRAX", "NASDAQ:WIMI", "NASDAQ:XNET", "NYSE:CCO", "NYSE:DLX", \
"NYSE:DMS", "NYSE:EEX", "NYSE:INUV", "NYSE:IPG", "NYSE:OMC", \
"NYSE:QUOT", "NYSE:TSQ", "NYSE:WPP"}

I wanted to look at seasonality -- I first tried "Return", but 20 cent stocks raised a dollar or two had 164% returns which skewed the data, "Price" was used. I wanted to check seasonality over a ten year period, 2021 worked but was only ten months, so 2020 was tried for 12 months.

p20 = FinancialData[secNN01y, "Price", {{2020}, {2020}, "Month"}];

enter image description here

Missing data in the first stock of the list, but if I kept deleting stocks for missing data soon there would not be any data to analyze. I tried using Table to reorganize the data by month, worked for 2021, but not for 2020 with missing data

p20T = Table[p20[[j, 2, 1, 1, i]], {i, 12}, {j, 25}];

I tried Pick with DateObjects on a limited set of data enter image description here

I wanted the mean of the stocks for each month, but the multiple levels in the data defeated Mean. With Rohit's helps the issue was partly resolved enter image description here

I tried to expand the data to the full year -- and missing data became an issue again enter image description here

The first stock in the list only has data for the last three months of 2020. When k calls for the 4th element in the list -- everything crashes

How does one work with FinancialData with all of its flaws???? I can not keep deleing stocks or else there will be so few, the data will be meaningless. If I can not take away, documentation says to replace the missing data with the mean of what is left -- but that is simply beyond my coding ability. Is there a better way???

POSTED BY: Raymond Low
5 Replies
Posted 2 years ago

One technique I have used is to find the most common lengths. For example,

Map[#["PathLength"] &, p20]
commonestPositions = Position[%, Commonest[%][[1]]]

Then choose those time series that have the most common lengths

p20bis = Extract[p20, commonestPositions]

This will give a list of time series that share the most common length.

Likewise,

secNN01ybis = Extract[secNN01y, commonestPositions]

will give a list of the corresponding symbols.

POSTED BY: Duncan Aitken
Posted 2 years ago

Hi Duncan,

Have to be careful with this approach because it is not guaranteed that the commonest length series all have the same time intervals.

POSTED BY: Rohit Namjoshi
Posted 2 years ago

Raymond,

I don't completely understand what you are trying to do, however, you are running into issues because you are trying to select data by indexing months and that will fail if there is no data for a particular month/stock. A way to avoid that is to group the data by month so missing months are not part of the group if data is missing. An example using the code from my previous post.

monthlyMean2020 =
monthlyPriceDataByYear //
(* Don't care about symbol, so drop it *)
Values //
(* Select 2020 values *)
Map[KeySelect[# == DateObject[{2020}, "Year"] &]] // Values // Flatten[#, 2] & //
(* Group by month *)
GroupBy[First -> Last] //
(* Mean by month *)
Map[Mean] // KeySort

Some months in the mean will have three values, one for each stock and some will have two (where ADV is missing), but that does not matter, the mean is computed from whatever data is available.

(* Mean of all data *)
mean2020 = monthlyMean2020 // Mean

Percent change from mean for each month

monthlyMean2020Percent = 100.*(monthlyMean2020 - mean2020)/mean2020

monthlyMean2020Percent // 
 BarChart[#, ChartLabels -> DateValue[Keys@monthlyMean2020, "MonthNameShort"]] &

enter image description here

You can try it on your full list of stocks and see if the result looks reasonable. If it does, you can remove the year selection and generate the chart for all years combined. Or compare the last 2 years with all previous years or ...

POSTED BY: Rohit Namjoshi
Posted 2 years ago

Thanks so much Rohit, The following was my thinking -- I have my list of sector stocks, AdvertisingAgencies, filtered for the nyse & nasdaq & 2021. A list of 25 stocks from a list of 133.

 secNN01y = {"NASDAQ:ADV", "NASDAQ:BOMN", "NASDAQ:CMPR", "NASDAQ:CNET", \
  "NASDAQ:CRTO", "NASDAQ:FLNT", "NASDAQ:ICLK", "NASDAQ:ISIG", \
  "NASDAQ:MCHX", "NASDAQ:MGNI", "NASDAQ:NCMI", "NASDAQ:QNST", \
  "NASDAQ:SRAX", "NASDAQ:WIMI", "NASDAQ:XNET", "NYSE:CCO", "NYSE:DLX", \
  "NYSE:DMS", "NYSE:EEX", "NYSE:INUV", "NYSE:IPG", "NYSE:OMC", \
  "NYSE:QUOT", "NYSE:TSQ", "NYSE:WPP"}

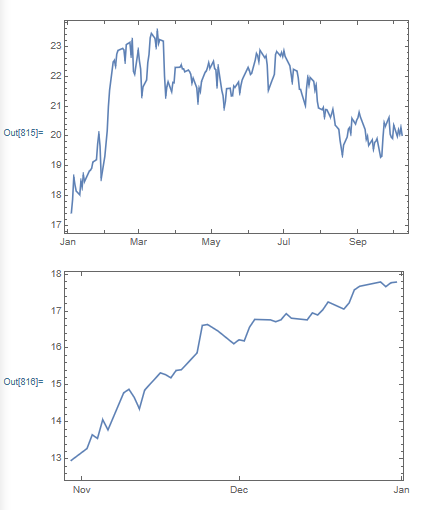
My question -- did advertiser's stock fall during the slow summer months and then rise towards Christmas?? I took the mean of the 25 stocks and plotted them, but was stymied by missing data.

o1 = DateListPlot[Mean[FinancialData[secNN01y, {2021}] ] ] 
o2 = DateListPlot[Mean[FinancialData[secNN01y, {{2020}, {2020}}] ] ] 

enter image description here

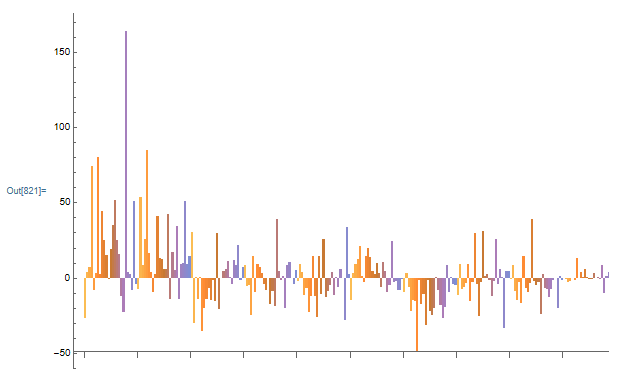
I used "Return" and reordered the data monthly and plotted it

m1 = FinancialData[secNN01y, "Return", {{2021}, {2021}, "Month"}];
m1T = Table[m1[[j, 2, 1, 1, i]], {i, 10}, {j, 25}];
BarChart[m1T]

enter image description here

Interesting, January and February did well and the summer months showed more negative returns, but I needed to look at, at least ten years of data. I must first simplify the data before I learned how to wrap the years. I took the mean of the reordered data, which I now believe was a mistake as mean averages columns not rows.

m1Tm = Table[Mean[m1T[[i]] ], {i, 10}]
BarChart[m1Tm, 
 ChartLabels -> {"Jan", "Feb", "Mar", "Apr", "May", "Jun", "Jul", 
   "Aug", "Sep", "Oct"}]

enter image description here

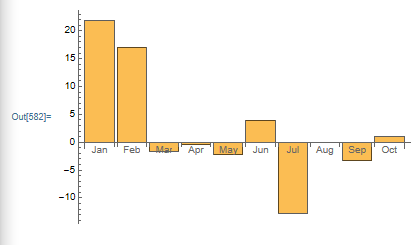
January did not seem right and found a penny stock that had a 164% gain, which was skewing the data and decided to use "Price" instead.

p1 = FinancialData[secNN01y, "Price", {{2021}, {2021}, "Month"}];
p1T = Table[p1[[j, 2, 1, 1, i]], {i, 10}, {j, 25}];
p1TMP = p1[[All, 2, 1, 1, All]] // Normal // Mean // Mean
p1Tm = Table[Mean[p1T[[i]] /p1TMP - 1], {i, 10}]
BarChart[p1Tm, 
 ChartLabels -> {"Jan", "Feb", "Mar", "Apr", "May", "Jun", "Jul", 
   "Aug", "Sep", "Oct"}]
BarChart[m1Tm, 
 ChartLabels -> {"Jan", "Feb", "Mar", "Apr", "May", "Jun", "Jul", 
   "Aug", "Sep", "Oct"}]

enter image description here

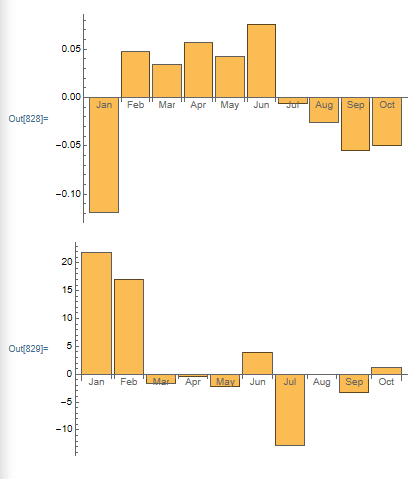
Same data but the charts look quite different. The top BarChart is based on the percent difference between the mean of the 25 stocks for each of the ten months in 2021 against the mean price of all the stocks over ten months. Whereas the bottom BarChart is the mean of the average "Return" for each stock for each month. One of the problems is that I used mean on the reordered data which remains and still needs to be investigated. And I did not know what Nov to Dec looked like, so I had to look at 2020. I tried the same template as I had used for 2021, but I was hampered by missing data

p20 = FinancialData[secNN01y, "Price", {{2020}, {2020}, "Month"}];
p20T = Table[p20[[j, 2, 1, 1, i]], {i, 12}, {j, 25}];
p20TMP = p20[[All, 2, 1, 1, All]] // Normal // Mean // Mean ;
p20Tm = Table[Mean[p20T[[i]] /p20TMP - 1], {i, 12}];
BarChart[p20Tm, 
 ChartLabels -> {"Jan", "Feb", "Mar", "Apr", "May", "Jun", "Jul", 
   "Aug", "Sep", "Oct", "Nov", "Dec"}]

if Table[] did not work maybe Pick[] might, I tried

Table[Pick[p20[[j, 2, 1, 1, k]]  , 
  DateWithinQ[DateObject[{2020, i}], 
   DateObject[p20[[j, 2, 2, 1, 1, k]]]] ], {i, 12}, {j, 25}, {k, 4}]

Pick[] worked up to k = 3 , but failed at k = 4 because of the missing data in stock ADV. What I was hoping for was a BarChart similar to the first one posted in this dialogue, with each bar representing one month's average difference ( ("montlyAverageStocksPrice" - "yearlyAverageStocksPrice") / "yearlyAverageStocksPrice" ) for each of the last ten years and plotting the 12 months in one chart. So the first ten bars would be January's averagePriceDifference for the years 2011 to 2021 and the next ten bars would be February's averagePriceDifference for the years 2011 to 2021. With this information I could determined if the advertising dollar changed throughout the year that influenced stock price. But the same problem remains, missing data kills functions......

POSTED BY: Raymond Low
Posted 2 years ago

Raymond,

There are some stocks for which FinancialData is incomplete. It looks like ADV is one of them. An option would be to download historical data from another source, Nasdaq or Yahoo and import it.

Can you explain what you mean by "I wanted to look at seasonality". If you want to compare the monthly price for various stocks across years then it would be better to organize the data to make it easier to do that. One option using a subset of your list.

stocks = {"NASDAQ:ADV", "NASDAQ:BOMN", "NASDAQ:CMPR"};
lookbackYears = 3;

monthlyPrice = 
 FinancialData[stocks, 
   "Price", {{2021 - lookbackYears}, {2021}, "Month"}] // AssociationThread[stocks, #] &

toMonth[date_] := DateObject[date, "Month"];
monthlyPriceData = monthlyPrice // Map[#["DatePath"] &] // MapAt[toMonth, #, {All, All, 1}] &

monthlyPriceDataByYear = monthlyPriceData // Map[GroupBy[DateObject[First[#], "Year"] &]]

Then you can visualize or analyze in different ways

monthlyPriceDataByYear // KeyValueMap[DateListPlot[#2, PlotLabel -> #1] &] // Column

enter image description here

monthlyPriceDataByYear // Map[KeySelect[# == DateObject[{2020}, "Year"] &]] // 
   DeleteCases[<||>] // Map[Last] // DateListPlot[#, PlotLabel -> "2020"] &

You have a lot more stocks on your list so you probably need different visualizations and analyses depending on your goal.

enter image description here

POSTED BY: Rohit Namjoshi
Reply to this discussion
Community posts can be styled and formatted using the Markdown syntax.
Reply Preview
Attachments
Remove
or Discard

Group Abstract Group Abstract