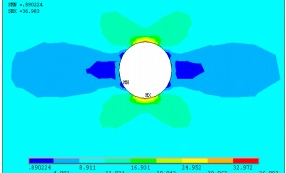
I want to plot the distribution below around a circle and shade it. Currently, I have it in a polar plot. My expectation is to have something close to the image below. The goal is to show damage distribution around the circle. Thank you.
PolarPlot[
 1/(4 Pi) + (5/16 Pi) (1 - 3 Cos[2 t]) +
  9/(256 Pi) (9 - 20 Cos[2 t] + 35 Cos[4 t]), {t, 0, 5 Pi}]