Thanks, Rohit. Well, no, ChartLabels and friends do not seem to work in this case. I only could make it in this clumsy way (notice the "\n" in the first framelabel):
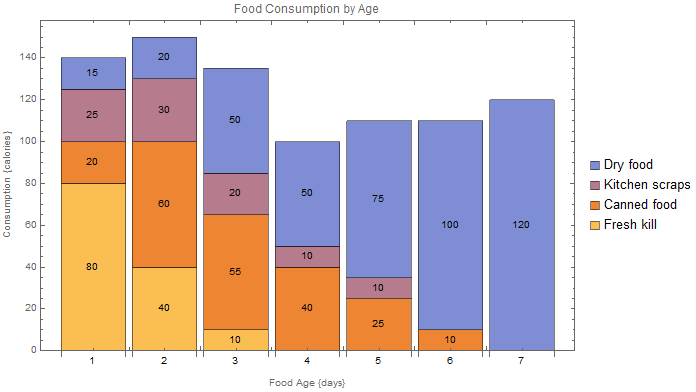
data = {{80, 20, 25, 15}, {40, 60, 30, 20}, {10, 55, 20, 50}, {0, 40,
     10, 50}, {0, 25, 10, 75}, {0, 10, 0, 100}, {0, 0, 0, 120}} /. 0 -> _;
bch = BarChart[data, ChartLayout -> "Stacked", Axes -> True,
   Frame -> True,
   FrameLabel -> {"\nFood Age {days}", "Consumption {calories}"},
   PlotLabel -> "Food Consumption by Age",
   ChartLegends -> {"Fresh kill", "Canned food", "Kitchen scraps",
     "Dry food"}, LabelingFunction -> Center, ImageSize -> Large];
dummydata = Range[7];
(* "invisible" barchart: *)
dummybch = BarChart[dummydata, LabelingFunction -> Below, ChartElements -> Graphics[{Opacity[0], Circle[]}]];
Show[bch, dummybch]