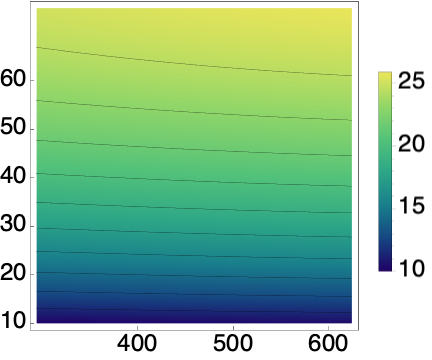
Thanks for providing the code and data. Is this is what you are looking for? Not sure why there are more than 6 contour lines though
data = HeffTempStr[[All, {1, 2, 4}]];
ListDensityPlot[data,
 PlotLegends -> Automatic,
 AxesStyle -> Directive[Black, Thick],
 LabelStyle -> Directive[Black, Large, FontFamily -> "Helvetica"],
 ColorFunction -> "BlueGreenYellow",
 FrameTicks -> {{{10, 20, 30, 40, 50, 60}, None}, {{400, 500, 600}, None}},
 Mesh -> {10, 12, 14, 16, 18, 20},
 MeshFunctions -> {#3 &}]
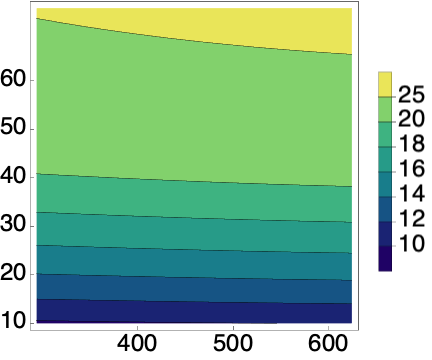
Maybe ListContourPlot is a better option? If you hover over a contour line the corresponding z value is shown as a tooltip.
ListContourPlot[data,
 PlotLegends -> Automatic,
 AxesStyle -> Directive[Black, Thick],
 LabelStyle -> Directive[Black, Large, FontFamily -> "Helvetica"],
 ColorFunction -> "BlueGreenYellow",
 FrameTicks -> {{{10, 20, 30, 40, 50, 60}, None}, {{400, 500, 600}, None}},
 Contours -> {10, 12, 14, 16, 18, 20, 25}]