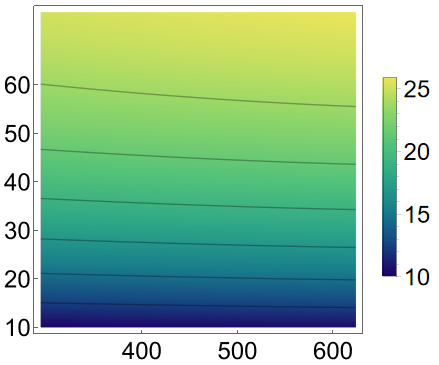
ListDensityPlot with 6 contour lines:
data = HeffTempStr[[All, {1, 2, 4}]];

ListDensityPlot[
    data,
    PlotLegends -> Automatic, AxesStyle -> Directive[Black, Thick],
    LabelStyle -> Directive[Black, Large, FontFamily -> "Helvetica"],
    ColorFunction -> "BlueGreenYellow",
    FrameTicks -> {{{10, 20, 30, 40, 50, 60}, None}, {{400, 500, 600}, None}},
    Mesh -> 6, MeshFunctions -> {#3 &}
 ]