Jon,
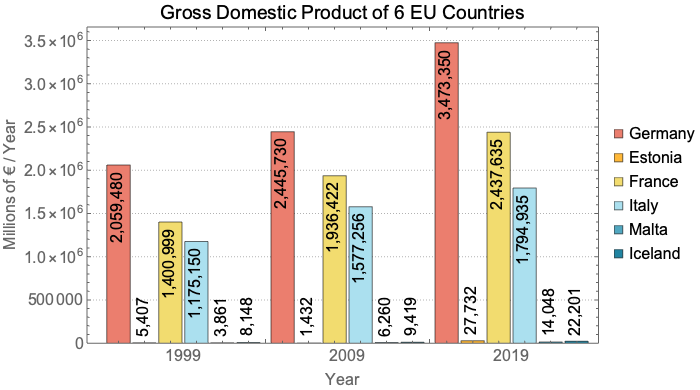
You have data for 6 countries, but the legend only shows 5. I think the missing country is Italy. Since the values vary so much, the bars for three of the countries are very small. This may be a better way
BarChart[alist,
 ChartLabels -> {{"1999", "2009", "2019"}, None},
 LabelStyle -> 16,
 PlotTheme -> "Detailed",
 ChartStyle -> ColorData[24],
 PlotLabel -> Style["Gross Domestic Product of 6 EU Countries", Black],
 FrameLabel -> {"Year", "Millions of € / Year"},
 ChartLegends -> {"Germany", "Estonia", "France", "Italy", "Malta", "Iceland"},
 LabelingFunction -> (Placed[Rotate[AccountingForm[#, DigitBlock -> 3], Pi/2], If[# < 10^6, Above, Top]] &),
 ImageSize -> 600]
For 3D
countries = {"Germany", "Estonia", "France", "Italy", "Malta", "Iceland"};
countryLabels = Style["\n\n\n" <> #, 11, Black] & /@ countries;

BarChart3D[alist,
 ChartLayout -> "Grid",
 ChartStyle -> "Pastel",
 ChartLabels -> {Style[#, 11, Black] & /@ {"1999", "2009", "2019"}, countryLabels},
 LabelingFunction -> Top,
 ImageSize -> 600]
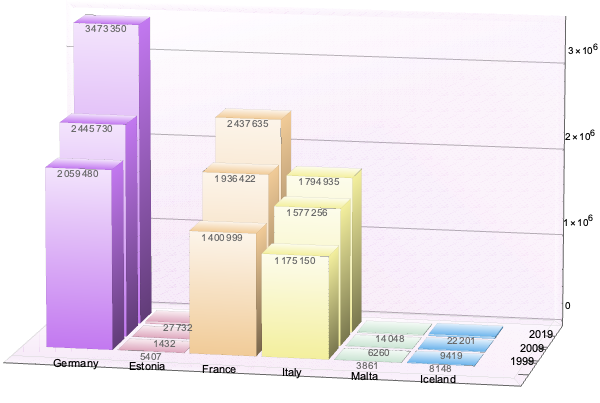
You can add title, labels, ...


