Message Boards Message Boards

0
|
1497 Views
|
2 Replies
|
0 Total Likes
View groups...
Share
Share this post:

Using function definition in plot caption?

Posted 2 years ago

Suppose I have defined f[z_]=z^2-4. Then I want to create a parametric plot for the function f (which I am able to do), that has the caption "f(z) = z²-4", i.e., I want to join the string "f(z) = " with the parsed output how the function f was defined before. How can I do that?

POSTED BY: Jakob Scholbach
2 Replies
Posted 2 years ago

Hi Jakob,

Here is one way

ClearAll@f    
f[z_] := z^2 - 4;

Plot[f[x], {x, 0, 4},
 PlotLabel -> Row[{HoldForm@TraditionalForm@f[x], " = ", TraditionalForm@f[x]}]]

enter image description here

POSTED BY: Rohit Namjoshi
Posted 2 years ago

This can be encapsulated in a function to make it easier to use

ClearAll@functionLabel;
SetAttributes[functionLabel, HoldAll];
functionLabel[function_] := Row[{HoldForm@TraditionalForm@function, " = ", 
 TraditionalForm@function}]

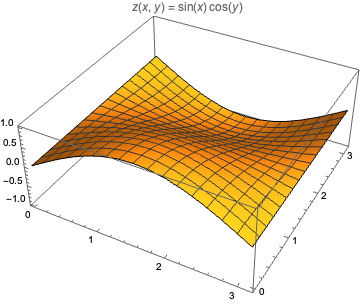
z[x_, y_] := Sin[x]*Cos[y]
Plot3D[z[x, y], {x, 0, Pi}, {y, 0, Pi}, PlotLabel -> functionLabel[z[x, y]]]

enter image description here

The MaTeX paclet can be used to generate typeset labels. e.g.

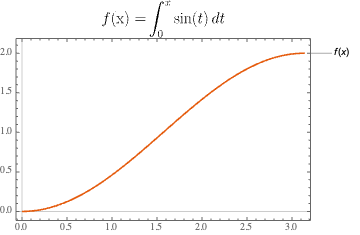
f[x_] := Evaluate@Integrate[Sin[t], {t, 0, x}]
Plot[f[x], {x, 0, Pi},
 PlotLabel -> MaTeX["f(\\text{x})\\text{ =}\\int_0^x \\sin (t) \\, dt", FontSize -> 16],
 PlotTheme -> "Scientific",
 PlotLabels -> "Expressions"]

enter image description here

POSTED BY: Rohit Namjoshi
Reply to this discussion
Community posts can be styled and formatted using the Markdown syntax.
Reply Preview
Attachments
Remove
or Discard

Group Abstract Group Abstract