In a recent Blog Post Stephen Wolfram showed that a lot of interesting geometry can be created just by iterating a simple function. The spirals are neat, some even seem to be works of art. It isn't immediately clear what a graph object has to do with science, so undergrads are left wanting more explanation. What is the simplest case where multi-computational paradigm can be applied to a textbook physics problem? One obvious candidate is Radioactive decay of Carbon atoms.
Say we have an array of $^{14}C$ atoms, and count $N$ of them at time $t=0$. After about $5,700$ years, we can expect to find about $N/2$ have decayed to nitrogen. Assuming atoms decay sequentially, how many possible paths through configuration space can we take? The simple answer is to choose $N/2$ from $N$ and take all possible permutations via the factorial function,
(*N = 2, 4, 6 . . .  *)
In[]:= Binomial[2 #, #] (#!) & /@ Range[6]
Out[]= {2, 12, 120, 1680, 30240, 665280}
And of course, this sequence is known on OEIS. To introduce a graphical method, we will instead sum over paths on a multiway graph. Represent a valid state as a list of $1$'s or $0$'s, with $1$ standing for Carbon, and $0$ standing for nitrogen. The iterator through configuration space decays exactly one Carbon atom in all possible ways.
Iterate[state_] := With[{locs = Position[state, 1][[All, 1]]},
  ReplacePart[state, # -> 0] & /@ locs]

Decay[nInt_] := NestList[Union[Flatten[Iterate /@ #, 1]] &,
  {Table[1, {nInt}]}, nInt]
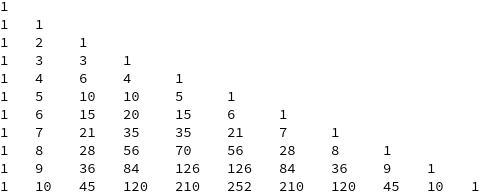
Examining the output of any given call to Decay[n], we notice that counting states in a particular generation follows a row of Pascal's triangle
PascalsTriangle[nInt_] := Table[Length /@ Decay[i], {i, 0, nInt}]
PascalsTriangle[10] // TableForm

This is a useful fact when plotting
IntEdgeMap[nInt_] :=
  MapIndexed[#1 -> #2[[1]] &,
   SortBy[Tuples[{1, 0}, nInt], -Total[#] &]];

DecayEdges[nInt_] := ReplaceAll[Flatten[Outer[If[
        HammingDistance[#1, #2] == 1, DirectedEdge[#1, #2], {}] &,
      #[[1]], #[[2]], 1] & /@ Partition[Decay[nInt], 2, 1]],
  IntEdgeMap[nInt]]

vertexSort[nInt_] := With[{offset = Divide[Max[#] - #, 2]
      &@PascalsTriangle[nInt][[-1]]},
  {#[[1]] +
      offset[[#[[2]]]], (1 - #[[2]])/nInt Binomial[nInt,
       Floor[nInt/2]]} & /@

   Map[Reverse[Position[Decay[nInt], #][[1]]] &,
    SortBy[Tuples[{1, 0}, nInt], -Total[#] &]]]

DecayGraph[nInt_] :=
 With[{HLs = nInt - NestWhileList[#/2 &, nInt, # > 1 &]},
  Show[Graphics[Line[{{0, - # Binomial[nInt, Floor[nInt/2]]/nInt },
        {Binomial[nInt, Floor[nInt/2]] + 1,
         - # Binomial[nInt, Floor[nInt/2]]/nInt }}] & /@ HLs],
   Graph[DecayEdges[nInt], VertexCoordinates -> vertexSort[nInt]]]]

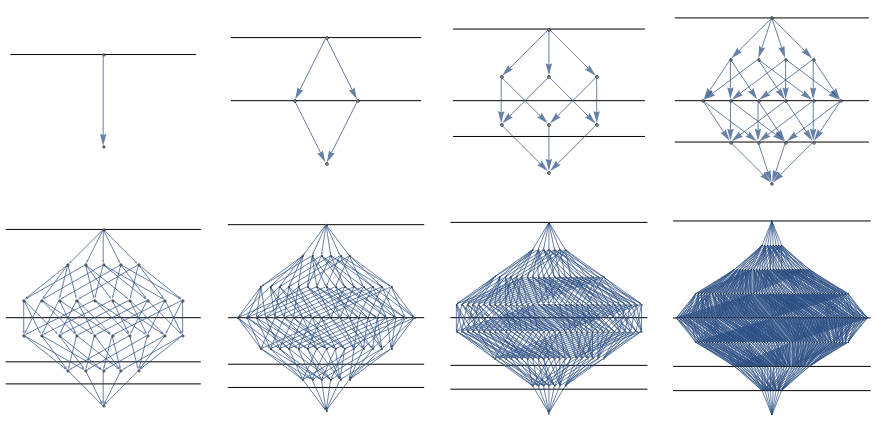
GraphicsGrid[Map[Show[#, ImageSize -> 200] &,
  Partition[DecayGraph /@ Range[1, 8], 4], {2}]]

Now let's examine features of these graphs, particularly even cases. Horizontal lines mark successive half-lives, and the first half life (for even cases) always intersects a row of $\binom{2n}{n}$ nodes with excatly $n$ edges directed into each node. If we follow the branching structure back to the root, we see that, on each preceding level, nodes have one less input. Thus we can derive the formula, that number of unique paths to one half life, $a(n) = \binom{2n}{n}n!=\frac{(2n)!}{n!}$.
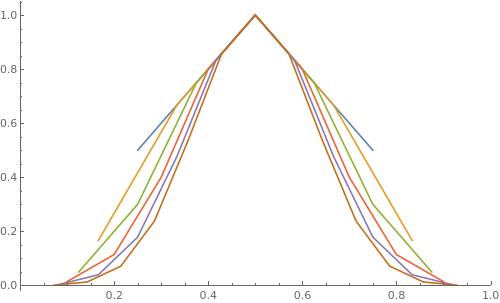
Another interesting question is about the profile of state space:
PascalDist[nInt_] :=  MapIndexed[ {#2[[1]]/(nInt + 2), #1} &,
  PascalsTriangle[nInt][[-1]]/Binomial[nInt, Floor[nInt/2]]]

ListLinePlot[PascalDist[2 #] & /@ Range[6],
 PlotRange -> {{0, 1}, Automatic}, ImageSize -> 500]

Does this limit tend to a definite shape? If yes what?