BSplineFunction returns a parameterized function with a domain that goes from 0 to 1. You need to find your root in the region between 0 and 1 and then use the function to get an {x,y} pair. Secondly, you can't use Part ([[]]) until the value is numeric because it will try to rip apart your spline function.
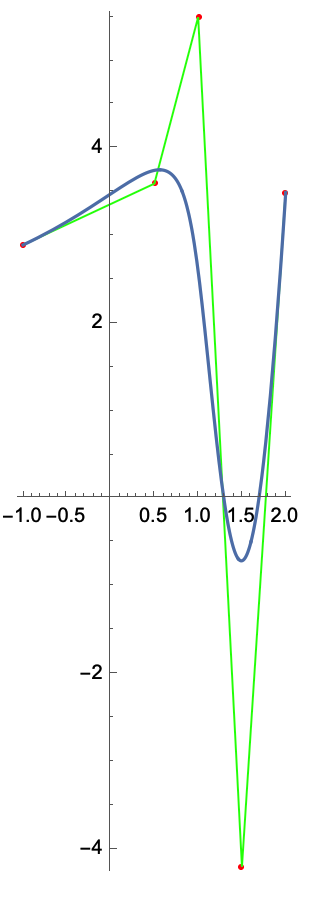
Show[Graphics[{Red, Point[data], Green, Line[data]}, Axes -> True],
 ParametricPlot[f[t], {t, 0, 1}]]
will plot your spline with the control points and show you the parametric function:
To find a root when the y value of the parametric plot crosses zero, you need to force Part to wait until the value of the function is numeric.
g[t_?NumberQ] := Last[f[t]]
or
g[t_?NumberQ] := f[t][[2]]
g returns the y value of the parametric function, f.
you can test it
Plot[{t, g[t]}, {t, 0, 1}]
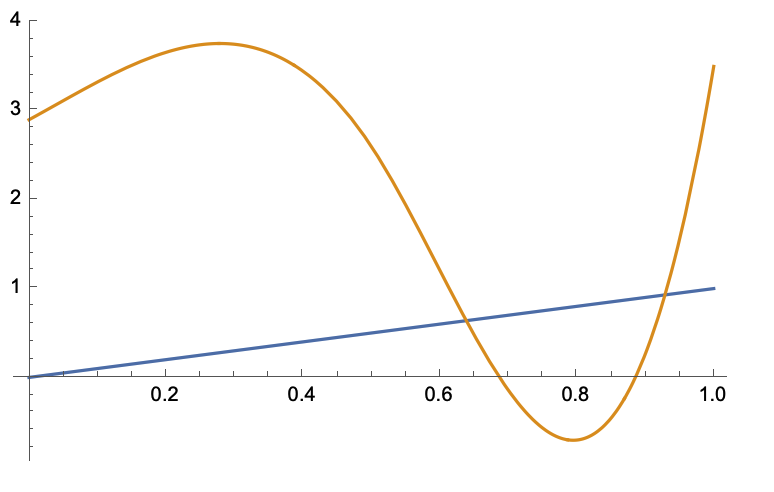
You plot from 0 to 1 and get the x values (a line) and the y values.
You can now get both roots:
In[24]:= r1 = FindRoot[g[t], {t, 0.4, 0.2, 1}]

Out[24]= {t -> 0.687292}

In[25]:= f[t] /. r1

Out[25]= {1.29408, 2.498*10^-16}

In[26]:= r2 = FindRoot[g[t], {t, 0.9, 0.2, 1}]

Out[26]= {t -> 0.885562}

In[27]:= f[t] /. r2

Out[27]= {1.69298, 1.55431*10^-15}
Regards,
Neil


