Message Boards Message Boards

0
|
2426 Views
|
4 Replies
|
1 Total Likes
View groups...
Share
Share this post:

How to check where is peak of a complicated function?

Posted 2 years ago

Hi. I have a code here. I think the plot of the function is not correct. Maybe my code has issues? What is that peak in the plot? How can I check if this function really has such a peak?

POSTED BY: Reza Hamzeh
4 Replies
Posted 2 years ago

Yes I did. It gives same result.

POSTED BY: Reza Hamzeh
Posted 2 years ago

I think the discontinuity is caused by these errors. Is there any way to fix these errors?

is there any way to fix these errors?

POSTED BY: Reza Hamzeh
Posted 2 years ago

Rather than N[Sum[... have you tried NSum?

POSTED BY: Rohit Namjoshi
Posted 2 years ago

Hi Reza,

The sampling you have chosen in Table is not fine enough to reveal the structure around 2.5. The spike occurs at r = 2.51

NeAB // MaximalBy[Last]
(* {{251/100, 0.512555}} *)

To examine that area in more detail

f[r_] := -2 N[
   Sum[1/
     12 (2 + 2 n - Sqrt[2 (5 + 2 n (2 + n) + 4 Cosh[2 r] + Cosh[4 r])]) Sech[r]^4 Tanh[r]^(2 n), 
    {n, 0, \[Infinity]}]]

This takes ~6 min on my laptop

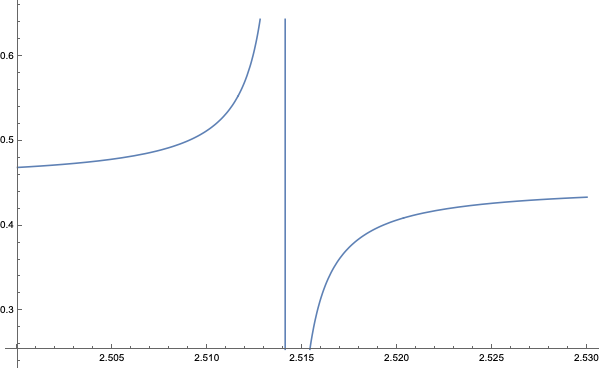
Plot[f[x], {x, 2.5, 2.53}, ImageSize -> 600]

The function has a discontinuity around r = 2.514

enter image description here

POSTED BY: Rohit Namjoshi
Reply to this discussion
Community posts can be styled and formatted using the Markdown syntax.
Reply Preview
Attachments
Remove
or Discard

Group Abstract Group Abstract