I want to Plot a CandlestickChart with a DateListPlot overlayed while retainining consistency over the x and y axes, which in my case are time and price.
As you can see the Show[...] function does not plot the second chart given and the Overlay[...] messes up the axes.
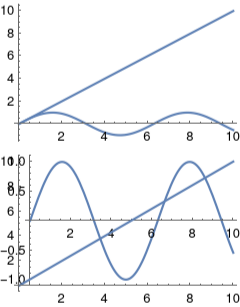
The Show[...] function when using other types of plot work as intended. Showing the difference here:
Show[Plot[Sin[x], {x, 0, 10}], Plot[x, {x, 0, 10}], PlotRange -> All]
Overlay[{Plot[Sin[x], {x, 0, 10}], Plot[x, {x, 0, 10}]}]