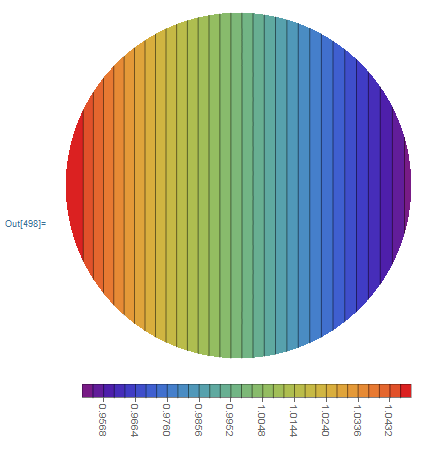
Hello, I am drawing a contour plot and rotating it -90 degree. PlotLegend is also rotating with it in the same direction. I don't want to rotate the plotlegend rather want it to be in the same place as before rotation. Is there any way ahead. Here i am attaching the figure along with the code.
ClearAll["Global`*"];
\[Lambda] = 0.0318;
\[Beta] = ArcSin[\[Lambda]/Sqrt[1 + \[Lambda]^2] ];
F = 0;
\[Epsilon] = 0.05;
ucap = 1 -
   r \[Epsilon] Sin[\[Zeta]] + \[Epsilon]^2 (-(1/4) +
      r^2 Sin[\[Zeta]]^2) + \[Epsilon]^3 (1/4 r Sin[\[Zeta]] -
      r^3 Sin[\[Zeta]]^3 +
      1/6 F r^2 Cos[\[Beta]] \[Lambda] Sin[2 \[Zeta]]);
vcap = F \[Epsilon] Cos[\[Beta]] Sin[\[Zeta]] + \[Epsilon]^2 (-(1/3)
         r^2 \[Lambda] Cos[\[Zeta]] +
      F^2 Cos[\[Beta]] Cos[\[Zeta]] Sin[\[Beta]] -
      F r Cos[\[Beta]] Sin[\[Zeta]]^2) + \[Epsilon]^3 (-(1/4)
         F Cos[\[Beta]] Sin[\[Zeta]] -
      F^3 Cos[\[Beta]] Sin[\[Zeta]] +
      1/2 F r^2 Cos[\[Beta]] Sin[\[Zeta]] +
      F^3 Cos[\[Beta]]^3 Sin[\[Zeta]] +
      5/6 r^3 \[Lambda] Cos[\[Zeta]] Sin[\[Zeta]] -
      1/2 F r^2 Cos[\[Beta]] Cos[2 \[Zeta]] Sin[\[Zeta]] +
      1/9 F r^2 \[Lambda] Sin[\[Beta]] Sin[\[Zeta]] -
      1/2 F^2 r Cos[\[Zeta]] Sin[2 \[Beta]] Sin[\[Zeta]]);
wcap = F \[Epsilon] Cos[\[Beta]] Cos[\[Zeta]] + \[Epsilon]^2 (-F r \
Cos[\[Beta]] Cos[\[Zeta]] Sin[\[Zeta]] -
      F^2 Cos[\[Beta]] Sin[\[Beta]] Sin[\[Zeta]]) + \[Epsilon]^3 (-(1/
        4) F Cos[\[Beta]] Cos[\[Zeta]] -
      F^3 Cos[\[Beta]] Cos[\[Zeta]] +
      1/2 F r^2 Cos[\[Beta]] Cos[\[Zeta]] +
      F^3 Cos[\[Beta]]^3 Cos[\[Zeta]] -
      1/2 F r^2 Cos[\[Beta]] Cos[\[Zeta]] Cos[2 \[Zeta]] +
      1/3 F r^2 \[Lambda] Cos[\[Zeta]] Sin[\[Beta]] +
      1/2 F^2 r Sin[2 \[Beta]] Sin[\[Zeta]]^2);
Vcap = Sqrt[ucap^2 + vcap^2 + wcap^2];
plot1 = Rotate[
  ContourPlot[
   Vcap /. {r -> Norm[{x, y}], \[Zeta] -> ArcTan[x, y]}, {x, -1,
    1}, {y, -1, 1},
   RegionFunction -> (Norm[{#, #2}] <= 1 &),
   Frame -> False,
   ContourShading -> Automatic,
   ColorFunction -> "Rainbow",
   PlotLegends -> Automatic,
   Axes -> False,
   Contours -> 30
   ], -90 Degree
  ]
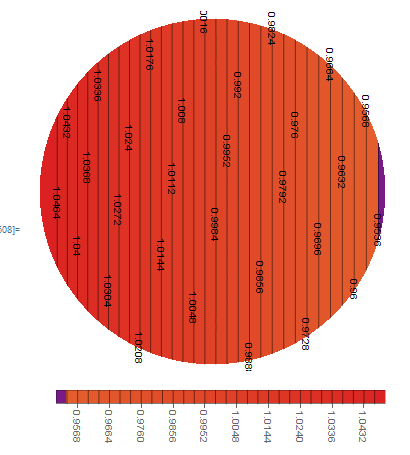
or can i label the contour lines only without changing the contourshading. cause adding contourlabels making the fig worst see fig2. Thanks