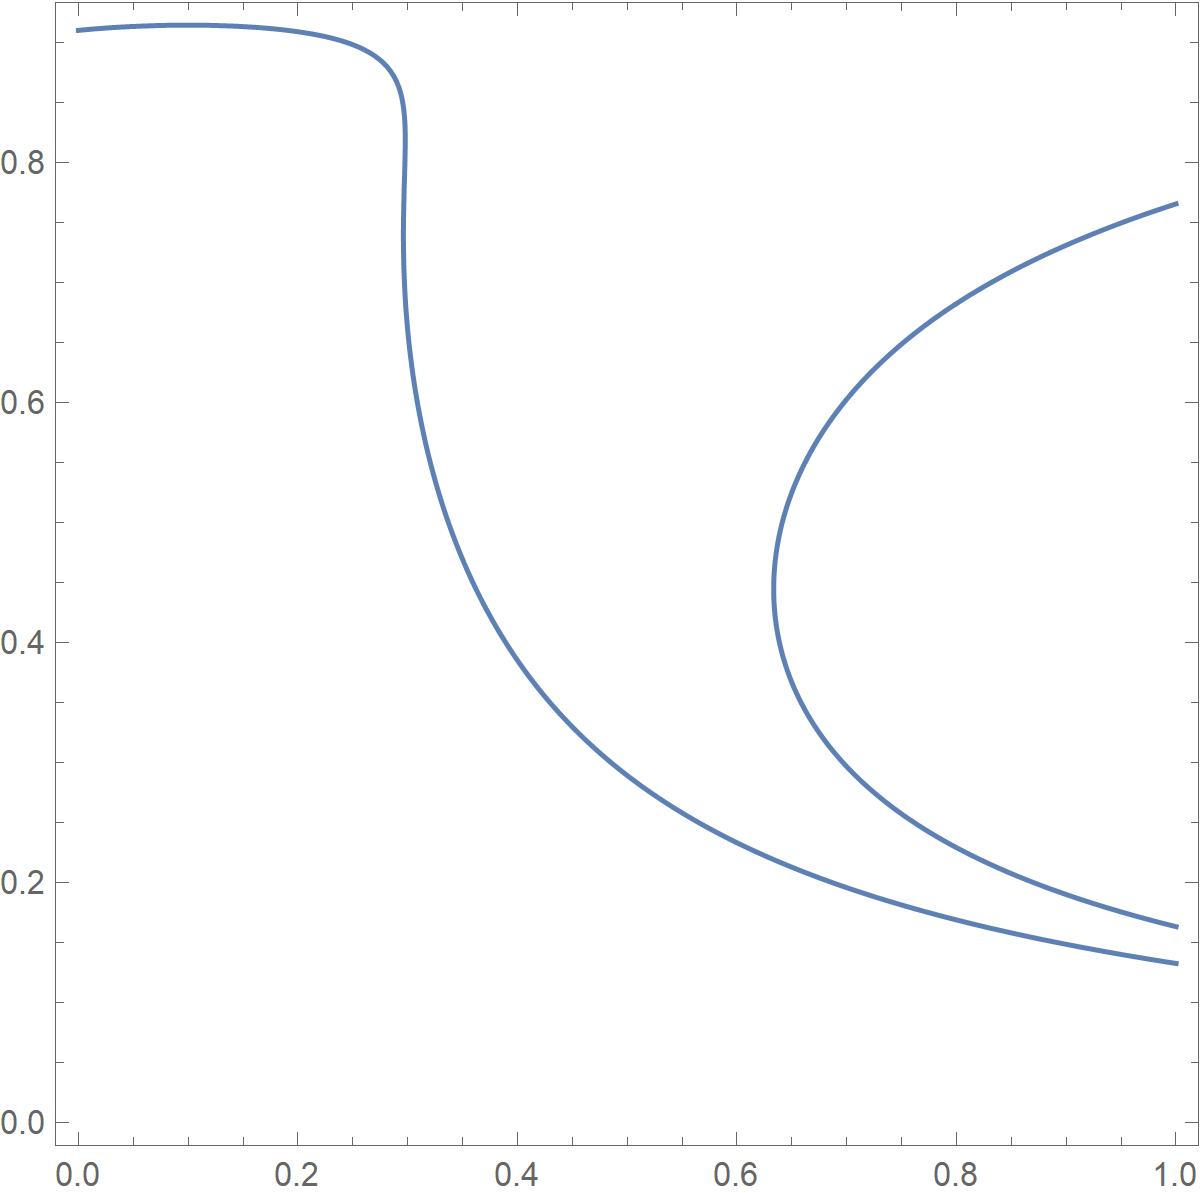
If one distinguishes an orbit diagram from a bifurcation diagram, where the bifurcation diagram shows periodic orbits, then you can use the more modern ImplicitRegion, e.g., the fixed points (for X=1) are given by
RegionPlot[
 ImplicitRegion[
  Nest[Function[m, Abs[Cos[4*c*Pi*m (1 - m)]/Log[3 - 4*c*m (1 - m)]]],
     x, 1] == x, {{c, 0, 1}, {x, 0, 1}}]]
 Unfortunately, it seems to take too long for others.
The basic idea of an orbit diagram is to drop the first 300 iterates which might mean you cut off the transients. Wishful thinking, but that's the standard thing to do. What you might be having trouble with is that you have two parameters (X and Y). Normally you just have one parameter. So here is a standard implementation of an orbit diagram.
Graphics[Table[
  Point[{c, #} & /@
    Drop[NestList[
      Function[m, Abs[Cos[4*c*Pi*m (1 - m)]/Log[3 - 4*c*m (1 - m)]]],
      RandomReal[], 400], 300]], {c, 0, .6, .01}],
 PlotRange -> {{0, 1}, {0, 1}}]
You probably want to decrease the increment for c.