Group Abstract Group Abstract

Message Boards Message Boards

0
|
4.1K Views
|
9 Replies
|
4 Total Likes
View groups...
Share
Share this post:

How to modify the axes label in ContourPlot?

Posted 3 years ago

Hello, I am trying to plot a contour, but finding it difficult to delete the axes label. I need the axes but not the label on the axes. Also can I label the contour inside the figure itself instead on legend bar.

\[Epsilon] = 0.3;
\[Lambda] = 1;
F = 0;
\[Beta] = ArcSin[\[Lambda]/Sqrt[1 + \[Lambda]^2] ];
Nu = 829440/(
  103680 - 8640 \[Epsilon]^2 + 3960 \[Epsilon]^4 + 297 \[Epsilon]^6 + 
   40 F^2 \[Epsilon]^6 \[Lambda]^2 + 
   40 F^2 \[Epsilon]^6 \[Lambda]^2 Cos[2 \[Beta]]);
T = Nu (1 /4 (1 - r^2) + \[Epsilon] 1 /
      8 (r^3 - 
        r) Sin[\[Zeta]] + \[Epsilon]^2 (1 /
         24 Cos[2 \[Zeta]] (r^4 - r^2) + (r^2/16 - r^4/32 - 1/
          32)) + \[Epsilon]^3 1 /
      32 Sin[\[Zeta]] (r^5 - r^3) + \[Epsilon]^3 1/
      72 F \[Lambda] Cos[\[Beta]] Sin[
       2 \[Zeta]] (r^2 - r^4) + \[Epsilon]^3 1/
      64  Sin[3 \[Zeta]] (r^3 - r^5));
ContourPlot[
 T /. {r -> Norm[{x, y}], \[Zeta] -> ArcTan[y, x]}, {x, -1, 
  1}, {y, -1, 1},
 ContourLabels -> Automatic,
 ColorFunction -> "DarkRainbow",
 RegionFunction -> (Norm[{#, #2}] <= 1 &),
 Frame -> False,
 Axes -> True,
 Contours -> 30,
 ContourShading -> Automatic,
 ContourLabels -> True,
 PlotLegends -> Automatic
 ]

enter image description here

POSTED BY: KRISHAN SHARMA
9 Replies

Hi Krishan

ContourLabels -> (Style[Text[#3, {#1, #2}], 20] &)

Robert

POSTED BY: Robert Nowak
Posted 3 years ago

Great!! Thanks

POSTED BY: KRISHAN SHARMA
Posted 3 years ago

If you want to change the size of the label and the tooltip

ContourLabels -> {Style[Text[#3, {#1, #2}], 20] &, 
  Tooltip[#3, #2, TooltipStyle -> FontSize -> 20] &}
POSTED BY: Rohit Namjoshi
Posted 3 years ago

Thanks!! Tooltip is a great feature.

POSTED BY: KRISHAN SHARMA
Posted 3 years ago

Rohit Namjoshi ji,

How to increase the font size of the Contourlables? I am trying but not getting it.

POSTED BY: KRISHAN SHARMA

Hi Krishan

ContourPlot[
 T /. {r -> Norm[{x, y}], \[Zeta] -> ArcTan[y, x]}, {x, -1, 
  1}, {y, -1, 1}, ColorFunction -> "DarkRainbow", 
 RegionFunction -> (Norm[{#, #2}] <= 1 &), Axes -> True, 
 Frame -> False, Ticks -> None, ContourLabels -> True, 
 Contours -> Range[.125, 2, .125], PlotRange -> All]

Robert

POSTED BY: Robert Nowak
Posted 3 years ago

Thanks Robert :)

POSTED BY: KRISHAN SHARMA
Posted 3 years ago

Hi Krishan,

One way to remove the tick labels is to set their opacity to 0. Remove the first ContourLabels -> Automatic so the second one ContourLabels -> True is used.
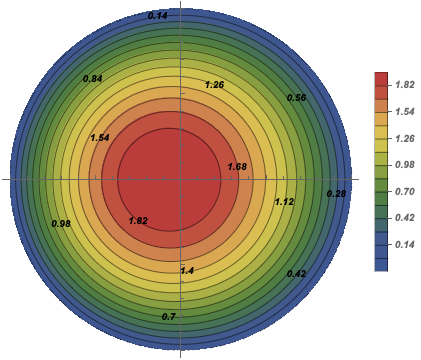
plot = ContourPlot[
  T /. {r -> Norm[{x, y}], \[Zeta] -> ArcTan[y, x]}, {x, -1, 
   1}, {y, -1, 1}, ColorFunction -> "DarkRainbow",
  RegionFunction -> (Norm[{#, #2}] <= 1 &),
  Frame -> False,
  Axes -> True,
  TicksStyle -> Directive[FontOpacity -> 0],
  Contours -> 30,
  ContourShading -> Automatic,
  ContourLabels -> True,
  PlotLegends -> Automatic]

The labels for 0 are repeated. To remove all of them

plot /. Text[0, _] :> Text[""]

enter image description here

POSTED BY: Rohit Namjoshi
Posted 3 years ago

Thanks Rohit :)

POSTED BY: KRISHAN SHARMA
Reply to this discussion
Community posts can be styled and formatted using the Markdown syntax.
Reply Preview
Attachments
Remove
or Discard