I want to be able to use Manipulate on Show[plot1,plot2] in order to make groups of plot appear/disappear. I've tried running the code below but the checkmarks doesn't add/remove the visibility of plots.
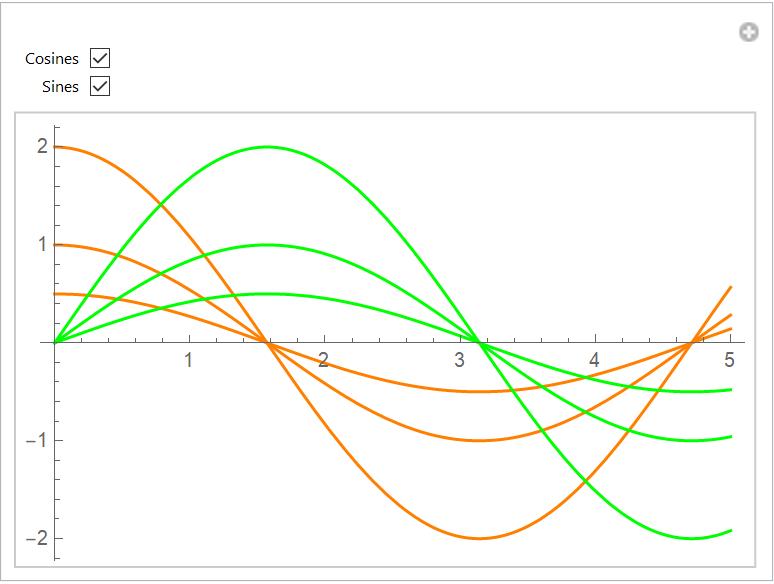
plot1 = Plot[{Cos[x], 2*Cos[x], 1/2*Cos[x]}, {x, 0, 5},
PlotLegends -> LineLegend["Expressions"], PlotStyle -> Orange];
plot2 = Plot[{Sin[x], 2*Sin[x], 1/2*Sin[x]}, {x, 0, 5},
PlotLegends -> LineLegend["Expressions"], PlotStyle -> Green];
Manipulate[
Show[plot1, plot2,
PlotStyle -> {Opacity[a], Opacity[b]}], {{a, 1, "Cosines"}, {1,
0}}, {{b, 1, "Sines"}, {1, 0}}, ControlPlacement -> Top,
FrameMargins -> 0]
The following produces the combined plot of: