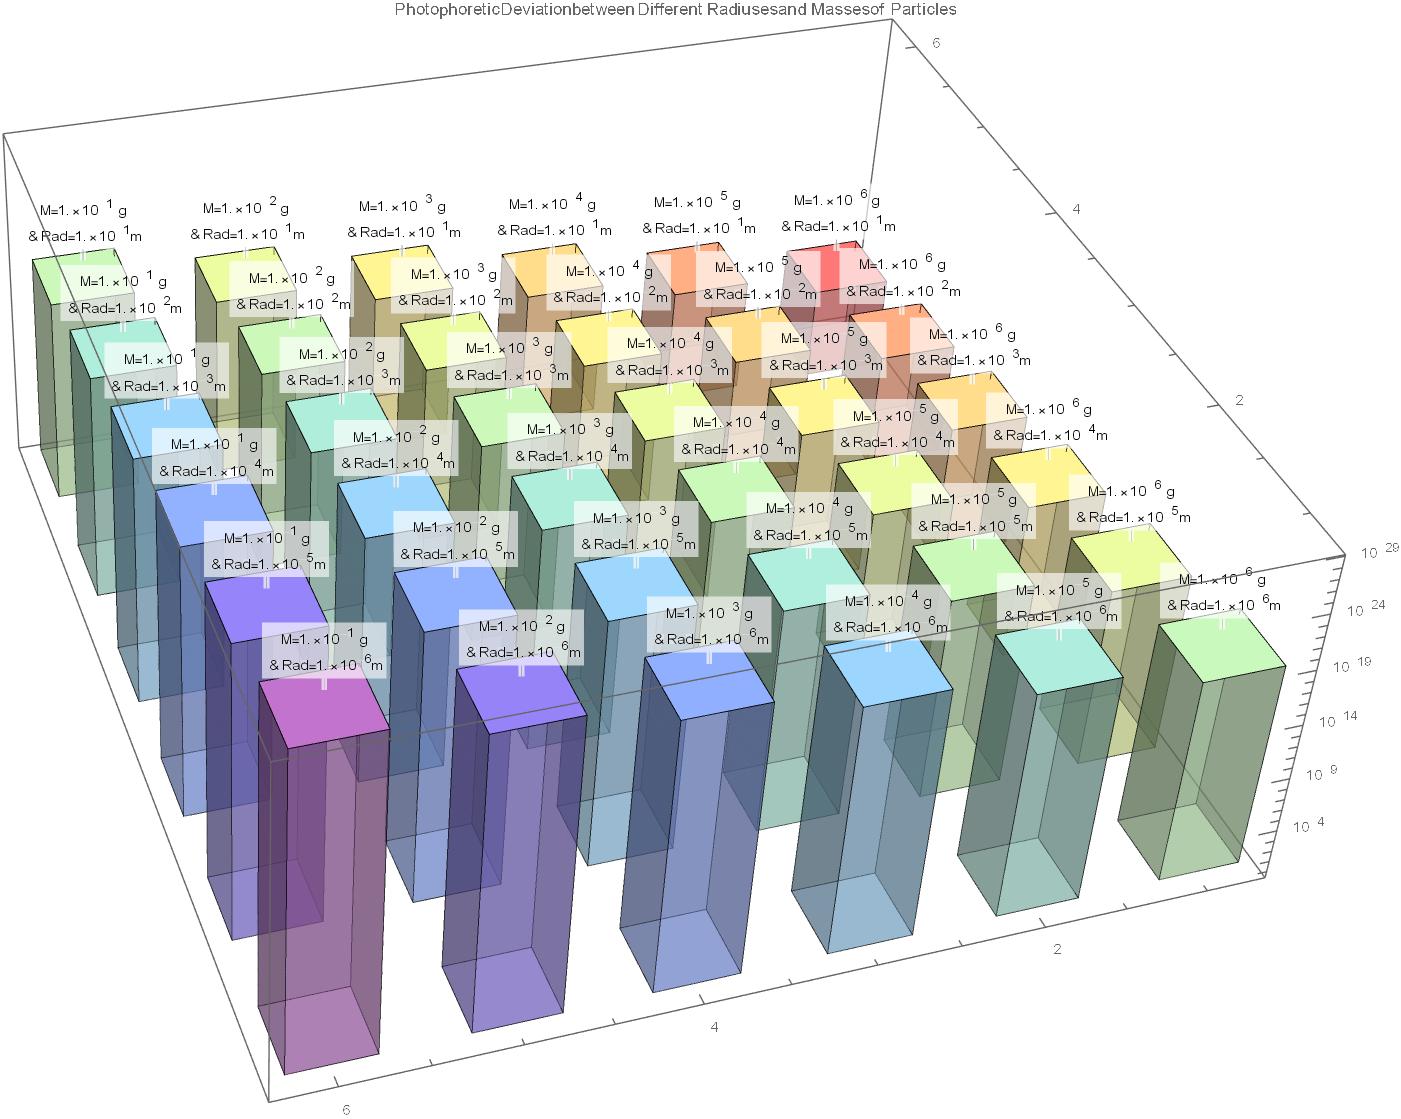
I want to use DiscretePlot3D on a Table of values that have Negative Exponents. However, its results ends up giving a taller plot to the values with lower values (i.e. 10^-21 has a taller plot than 10^-9).
ALPHAkSUBTRACTED = {{2.889`*^-19, 3.856`*^-17, 3.952`*^-15,
    3.962`*^-13, 3.963`*^-11, 3.963`*^-9}, {2.889`*^-21, 3.856`*^-19,
    3.952`*^-17, 3.962`*^-15, 3.963`*^-13, 3.963`*^-11}, {2.889`*^-23,
     3.856`*^-21, 3.952`*^-19, 3.962`*^-17, 3.963`*^-15,
    3.963`*^-13}, {2.889`*^-25, 3.856`*^-23, 3.952`*^-21, 3.962`*^-19,
     3.963`*^-17, 3.963`*^-15}, {2.889`*^-27, 3.856`*^-25,
    3.952`*^-23, 3.9623`*^-21, 3.963`*^-19,
    3.963`*^-17}, {2.889`*^-29, 3.856`*^-27, 3.952`*^-25, 3.962`*^-23,
     3.963`*^-21, 3.963`*^-19}};

DiscretePlot3D[
   Callout[ALPHAkSUBTRACTED[[Mass, Radius]],
     StringForm["M=`` g
    & Rad=``m", SCIENTIFICparticleclass[[Mass]],
   SCIENTIFICparticleclass[[Radius]] ], Above], {Mass, 1,
      6}, {Radius, 1, 6}, ColorFunction -> "Rainbow",
 ExtentSize -> 0.5, AxesLabel -> {"Mass", "Radius", "alphaK"},
   PlotLabel ->
  "Photophoretic Deviation between Different Radiuses and Masses of \
Particles", ImageSize -> 1000, ScalingFunctions -> "Log"]
Plots the following Matrix

Into the DiscretePlot3D of:

How do I plot the following DiscretePlot3D in order to make the red pillar the tallest and the purple pillar the shortest. Is there a certain Scaling Function that I can use in order to plot the one with the lowest value to be the shortest (10^-23) and the highest value to be the longest (10^-9)? Also, What Rotate Function configuration do I use to automatically 'flip' the plot upside down? The table of values is also attached for reference.
