I have a list of x,y coordinate pairs that are the offsets from the centerline for a hull form. I can plot the hull contour with ListLinePlot as shown in the attached Notebook, but I can't see how to use this with RevolutionPlot3D to rotate that curve around the x axis to generate the 3D surface of the hull?
Perfect! Thank you so very much.
Kevin,
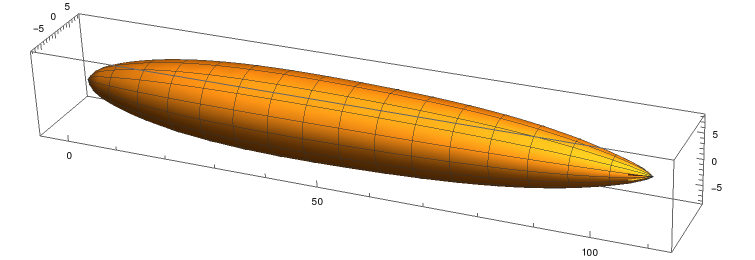
here is one way: First you generate an InterpolatingFunction from your data, and then you need the option RevolutionAxis:
InterpolatingFunction
RevolutionAxis
curve = Interpolation[xyCoords];
RevolutionPlot3D[curve[t], {t, 0, 108}, RevolutionAxis -> {1, 0, 0}]