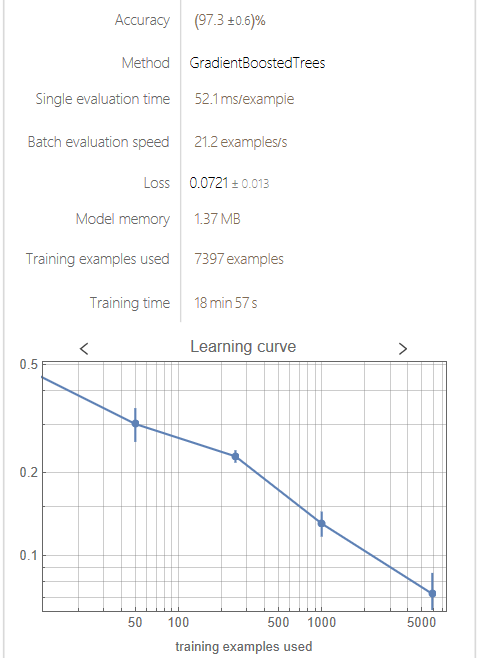
Hello, I am classifying two category of molecules based on their coordinates (Numerical Vector Sequence type Data). I have trained Gradient Boosted Trees using Classify[ ]. But I don't understand the Learning curve that Mathematica is generating. Which parameter is on Y-axis in the curve? is it error on y-axis in the learning curve?
Also, I need to plot Decision Boundary plot for the trained model.
Can anyone help me understand the Learning curve and plot decision boundary plot for gradient boosted trees. Like this one 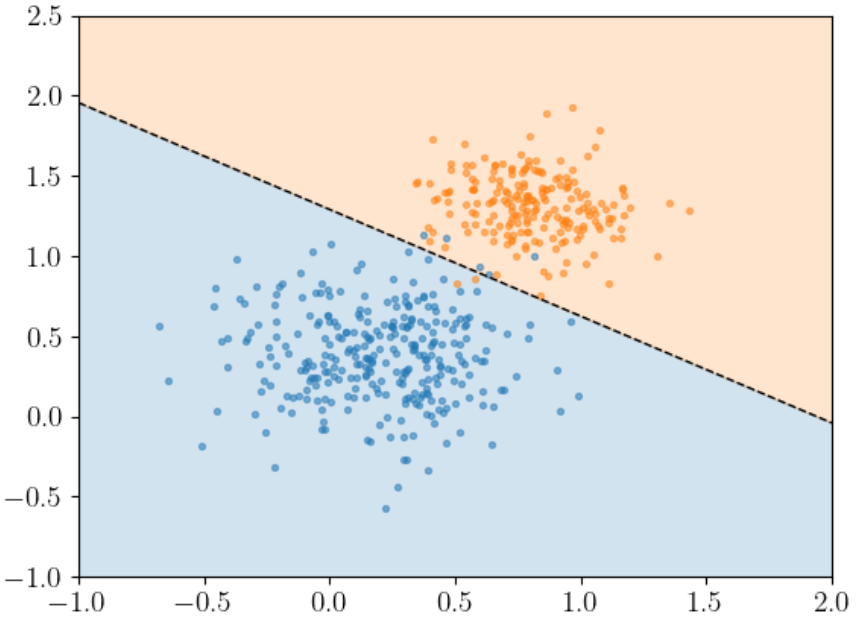 .
.


