James,
RevolutionPlot3D has the attribute HoldAll, so - just to avoid the error message - the argument needs to be evaluated:
RevolutionPlot3D[Evaluate[z /. OblateSpheroidProfile[r0, r]], {r, 0, r0}]
But I guess the output is not what you are expecting ...
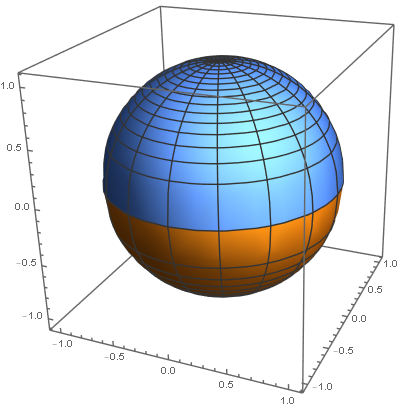
If you would rather like to see a sphere, you need two functions to be "rot-plotted", e.g. like so:
yFuncts = z /. OblateSpheroidProfile[r0, r];
functs = {r, #} & /@ yFuncts;
RevolutionPlot3D[Evaluate@functs, {r, 0, r0}]
Addendum: We get the same result by putting both of your original functions into a seperate List:
functs1 = List /@ (z /. OblateSpheroidProfile[r0, r]);
RevolutionPlot3D[Evaluate[functs1], {r, 0, r0}, BoxRatios -> {1, 1, 1}]
This is somewhat simpler and more intuitive.


