I have some data in the form of {{X,Y},Z} that I want to interpolate for Z. (X takes the values from 0 to 40 and Y from 0 to 50000 and Z is from -10 to +10 and the data I have, have integer values of Z and I want to interpolate for obtaining real values of Z also.
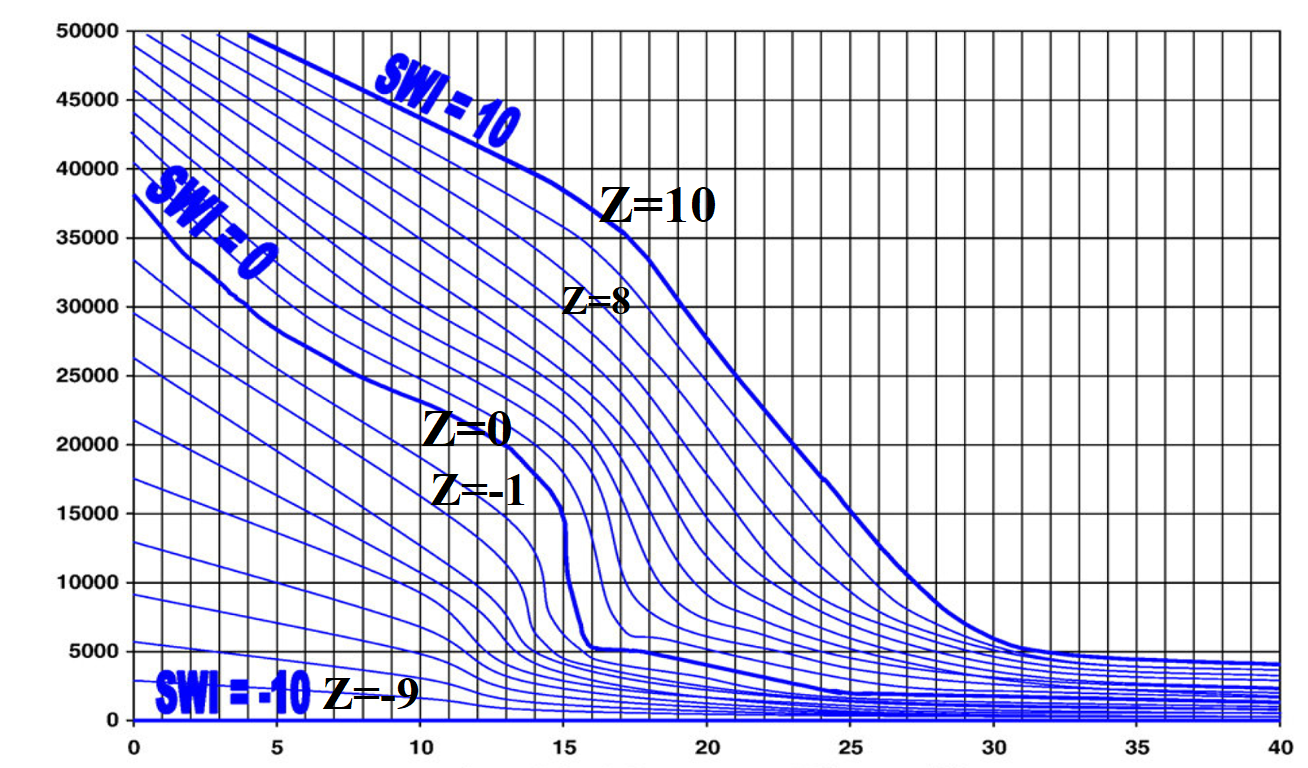
The graph of the data is: 
The data is on the form:
dataori={{{4.00,49741.80},+10.0},{{4.65,49153.60},+10.0},{{5.28,48506.40},+10.0},{{5.93,47918.20},+10.0},................................{{0.1,52840.6},9},{{0.0,53348.9},10},{{0.1,53258.7},-10}};
For full data I provide the Mathematica notebook as an attachment.
Using Interpolation to interpolate them:
g = Interpolation[dataori, InterpolationOrder -> 1 ]
I get the nightmare: "There are duplicated abscissa points in....." I have checked the data and do not see any intersecting points at all. So I'm puzzled.
After applying:
dataorisorted = Union[dataori]
Interpolation still complains with the same message.
Only after I do:
dataoridelete = DeleteDuplicatesBy[dataorisorted, First]
It works fine and finally interpolates them, but who knows what data has been erased.
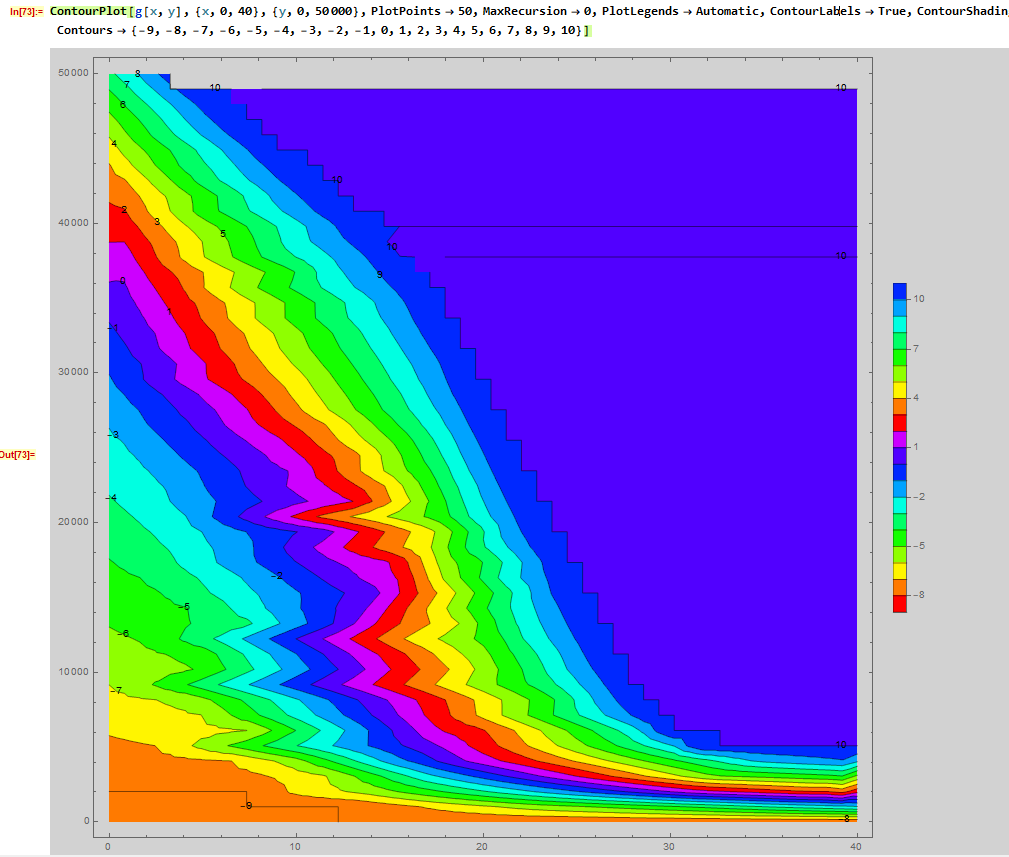
And the interpolation graph is not good. It has those wavy values for Z that there isn't such thing in the original data.

Trying to eliminate the wavy thing, I have manually interpolated for every integer Z from -10 to +10, so the data was this time in the form {X,Y} (so I interpolated a line each time), to then obtain multiple values for every Z for all X with a 0.1 step for X. E.g for Z=+3 I obtained:
{{0.0, 44096.8}, +3.0}, {{0.1, 43938.1}, +3.0}, {{0.2,43779.4}, +3.0}, {{0.3, 43620.6}, +3.0}, {{0.4,43461.9}, +3.0}, {{0.5, 43300.4}, +3.0}, {{0.6,43125.6}, +3.0}, {{0.7, 42950.8}, +3.0}, ....etc
But now Interpolation again does not work and gives the message "There are duplicated abscissa points in.....". I have checked the data and again no intersecting whatsoever.
After applying:
datasorted = Union[data]
datadelete = DeleteDuplicatesBy[datasorted, First]
f = Interpolation[datadelete, InterpolationOrder -> 1 ]
It gives:
Interpolation::femimq: The element mesh has insufficient quality of 0.`. A quality estimate below 0. may be caused by a wrong ordering of element incidents or self-intersecting elements.

Interpolation::fememtlq: The quality 0.` of the underlying mesh is too low. The quality needs to be larger than 0.`.
And I do not know what is wrong?!
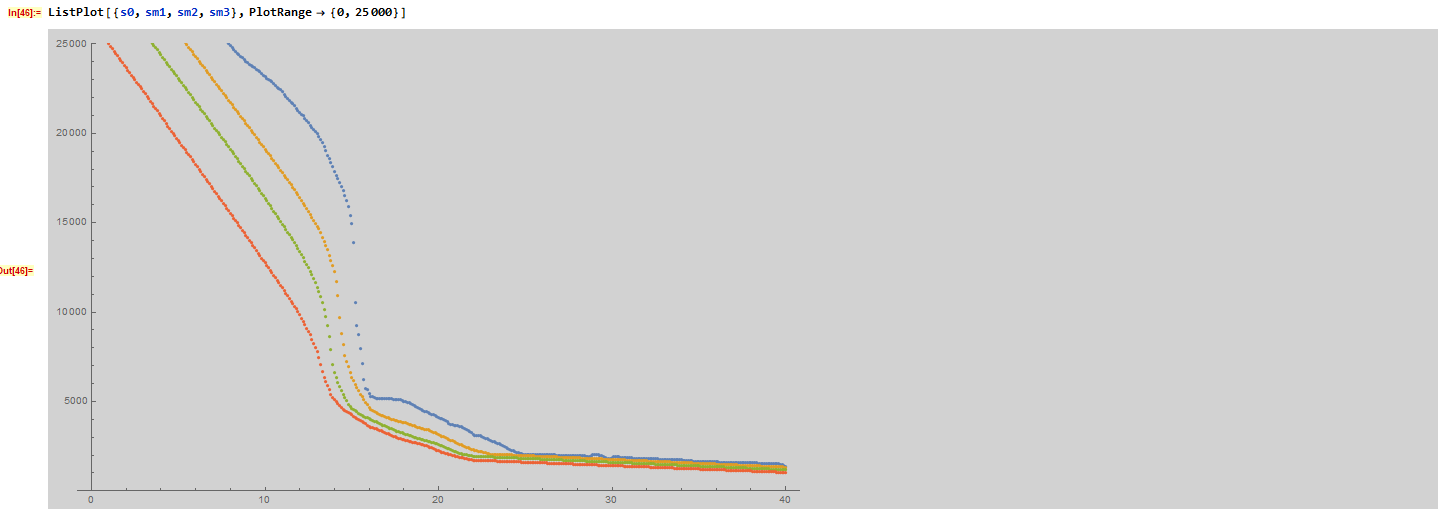
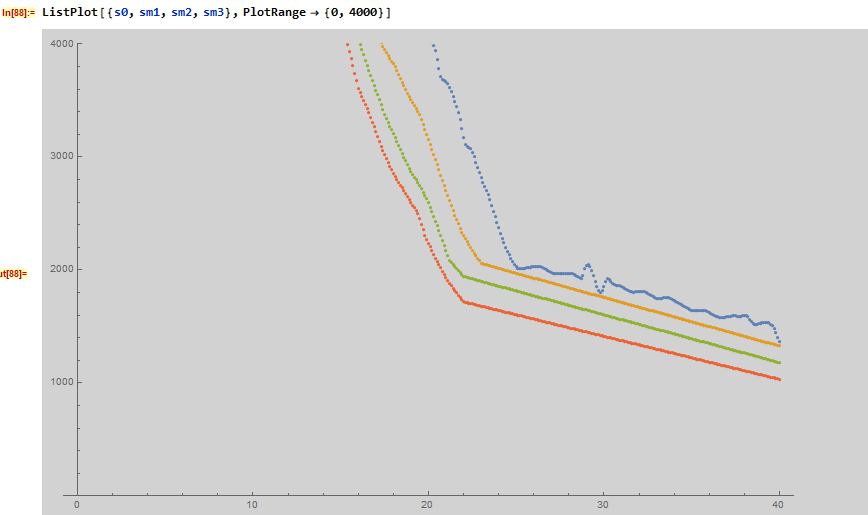
The graph of the data is: 
And the graph of Mathematica for it, for e.g Z=0 and -1 and -2 and -3 is this: 

 Attachments: