Message Boards Message Boards

0
|
4583 Views
|
2 Replies
|
3 Total Likes
View groups...
Share
Share this post:

Using TimeSeries as an Interpolator

Posted 2 years ago

Would like to use the results of WeatherData to make tables of temperature and relative humidity on an hourly basis. Below is my first attempt. It is intended to return the temperature for the first 10 hours of 2021 July 1st; however, it returns "missing data" for some of the entries, -- so it isn't doing the interpolation.

phx = CityData[{"Phoenix", "Arizona", "UnitedStates"}]
wdTemp = WeatherData[phx, 
  "Temperature", {{2021, 6, 30}, {2021, 10, 2}}]
{#, wdTemp[{2021, 7, 1, #}]} & /@ Range[10]

The help pages for WeatherData and TImeSeries didn't quite answer the question (or I couldn't find it).
Thanks for your help.

POSTED BY: Robert McHugh
2 Replies

Robert,

Adiba Shaikh already gave the important hint by mentioning DeleteMissing. An obvious approach using function interpolation could be this:

phx = CityData[{"Phoenix", "Arizona", "UnitedStates"}];
wdTemp = WeatherData[phx, "Temperature", {{2021, 6, 30}, {2021, 10, 2}}];
(* interpolating function: *)
wdTempFunc = DeleteMissing[wdTemp]["PathFunction"];

(* "... It is intended to return the temperature for the first 10 \
hours of 2021 July 1st ...": *)
datetime = DateRange[DateObject[{2021, 7, 1, 1, 0, 0}], DateObject[{2021, 7, 1, 10, 0, 0}], Quantity[1, "Hours"]];

(* result: *)
temperatures = {#, wdTempFunc[AbsoluteTime[#]]} & /@ datetime

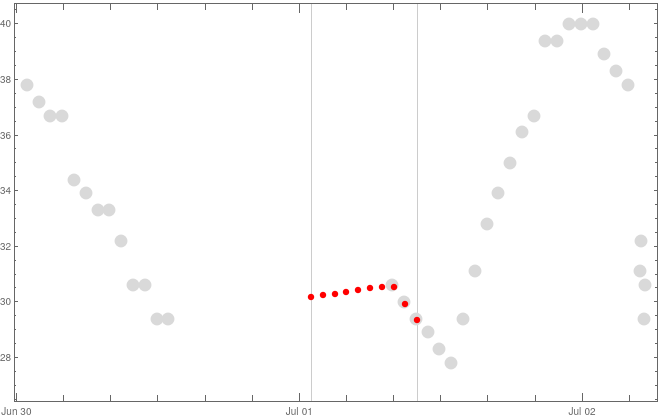
But a quick glance at the data itself shows that this does not make sense here: In the time range in question the data are simply too coarse, too many data points appear to be missing - it does not agree with the expected daily pattern!

dlp = DateListPlot[{Normal[wdTemp][[;; 40]], temperatures}, 
  GridLines -> {MinMax[datetime], None}, Joined -> False, 
  PlotStyle -> {{PointSize[.02], LightGray}, {PointSize[.01], Red}}]

enter image description here

POSTED BY: Henrik Schachner

Modifying your code slightly as follows should give you the temperature values:

phx = CityData[{"Phoenix", "Arizona", "UnitedStates"}]
(* wdTemp=WeatherData[phx,"Temperature",{{2021,6,30},{2021,10,2}}] *)
wdTempJuly = WeatherData[phx, "Temperature", {2021, 7, 1}]
Take[wdTempJuly["Values"],10]

Use DeleteMissing to remove any missing data. You can better visualize the data using DateListPlot for the TimeSeries. We can also use QuantityMagnitude to get the temperature values for the first 10 hours of July 1, 2021.

wdTempJuly = WeatherData["Phoenix", "Temperature", {2021, 7, 1}]
DateListPlot[wdTempJuly]
Take[Normal[QuantityMagnitude[wdTempJuly] // DeleteMissing], 10]
POSTED BY: Adiba Shaikh
Reply to this discussion
Community posts can be styled and formatted using the Markdown syntax.
Reply Preview
Attachments
Remove
or Discard

Group Abstract Group Abstract