Hi all,
I did the ShortTimeFourier(stf) Transformation of the following signal. 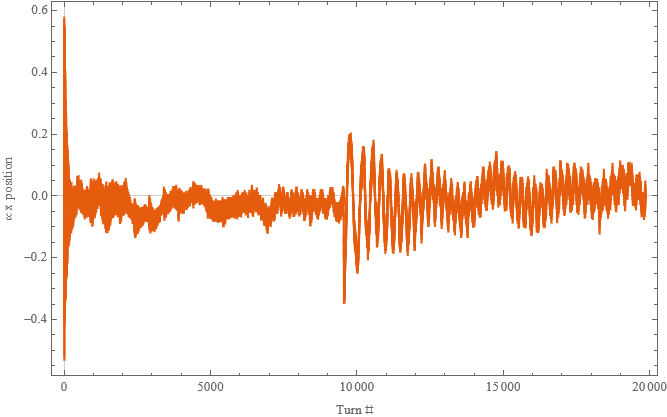
And got the results as shown in this Spectrogram. 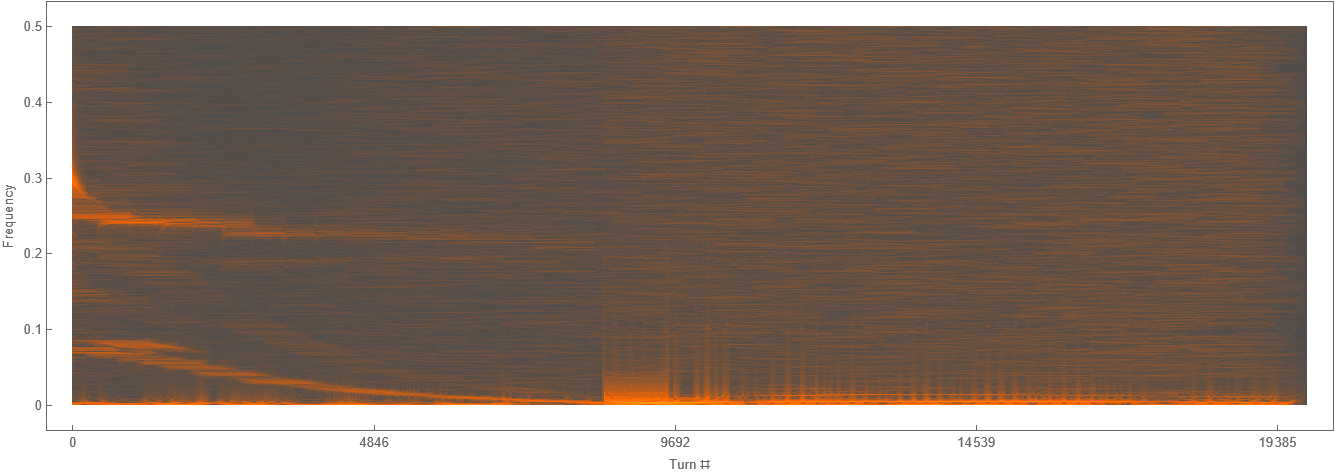
Then I wanted to find the peak frequency of this each turn using PeakDetect as:
Qpeak = Table[PeakDetect[GaussianFilter[Abs[stf[[b]]["Data"][[turn]]], [Sigma]], [Sigma]/ 2, 0, qthreshold], {b, numpeaks}];
And plot it using MatrixPlot as below. 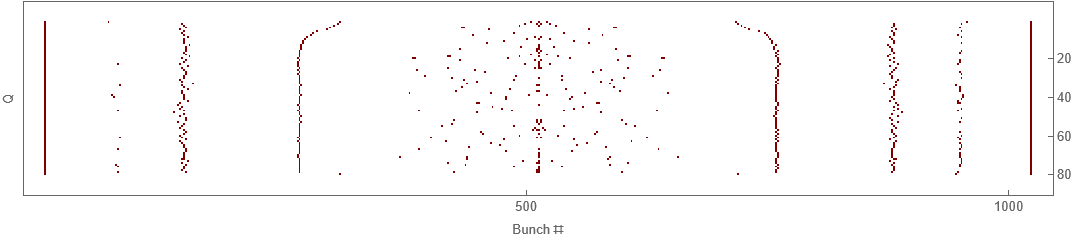
As you can see, the right side of the plot is the mirror image of the left side.
So my question is that I couldn't figure out which side (left or right) shows the imaginary side of the amplitude and which side shows the real side?
Could you please help me with this? I appreciate any help you can provide.


