Hello -- I have several examples of trying to show the change of some parameter on the shape of a function. I am plotting the "base" function (i.e., Sin[x]) and using the Manipulate function to show the changes of the function: a Sin[k x + phi]. The issue comes when I use the Manipulate function to superimpose the two functions. I would like the PlotLabel of the function being manipulated to update in real time. I'm running into the following issue:
Manipulate[
 Plot[{Sin[x], a Sin[k x + phi]}, {x, 0, 2 Pi},
  PlotLabels -> Placed[Automatic, Above ]],
 {k, .1, 4}, {a, 1, 2}, {phi, 0, 2 Pi}
 ]
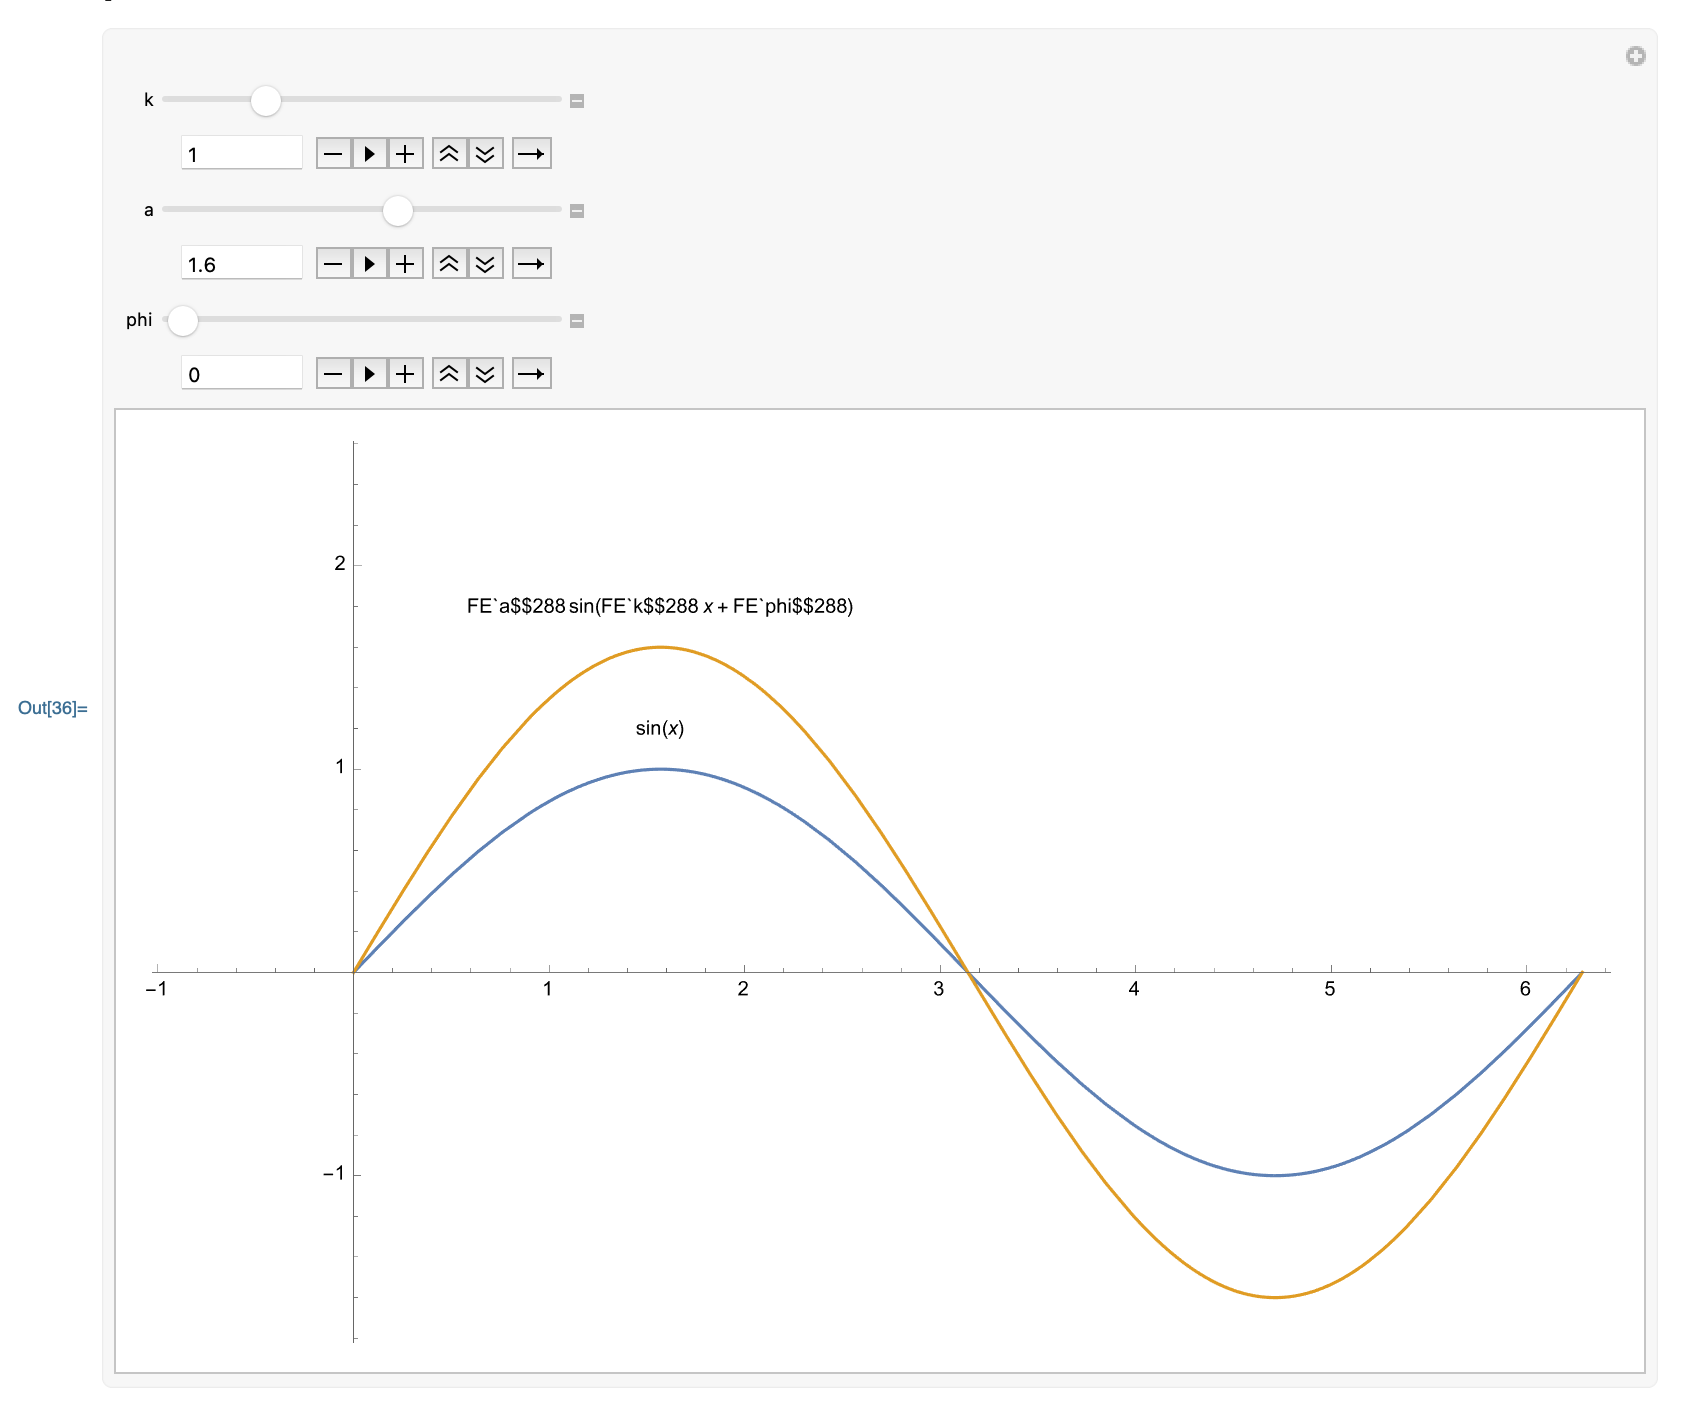
And here is the output. As you can see, the label for the "static" function is showing up fine... but the label for the function that is being manipulated is garbled.
Any suggestions would be welcome!