Group Abstract Group Abstract

Message Boards Message Boards

0
|
2.7K Views
|
2 Replies
|
2 Total Likes
View groups...
Share
Share this post:

Unexpected output from ListLinePlot?

Hey,
I'm trying to plot this:

ListLinePlot[{{1/9.304*10^-1,2.910*(10^-3)},
{1/8.3743*10^-1,2.9054*(10^-3)},
{1/7.4438*10^-1,2.91901*(10^-3)},
{1/6.5133*10^-1,2.9050*(10^-3)},
{1/5.5828*10^-1,2.91445*(10^-3)},
{1/4.6523*10^-1,2.9178*(10^-3)},
{1/3.721*10^-1,2.9611*(10^-3)},
{1/2.7914*10^-1,2.9635*(10^-3)},
{1/1.8609*10^-1,3.08623*(10^-3)},
{1/9.3047*10^-2,3.336097*(10^-3)}}]

But the graph comes out like that enter image description here

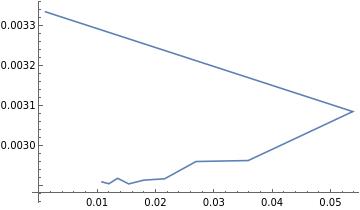
I'm sorry for the probably really basic level of knowledge question, but it's the first day I'm using Mathematica, does someone know why the line goes up to the left like that? it should not do it

POSTED BY: Yoav Wasserman
2 Replies
POSTED BY: Henrik Schachner
Posted 4 years ago

Well, that's what your data looks like. If the graph isn't what you expected, then either you didn't actually look at your data or your data is wrong. How did you generate the data?

POSTED BY: Eric Rimbey
Reply to this discussion
Community posts can be styled and formatted using the Markdown syntax.
Reply Preview
Attachments
Remove
or Discard