Dear people and Wolfram Team:
I was searching for geostatistical tools on the Resources page, and unfortunately I cannot find a basic function called the Variogram. What I found was a related (but a bit more complicated) function called Covariance.
According to Sourav Das (PhD 2011, source here), the definition of a variogram (and covariance) is the following: 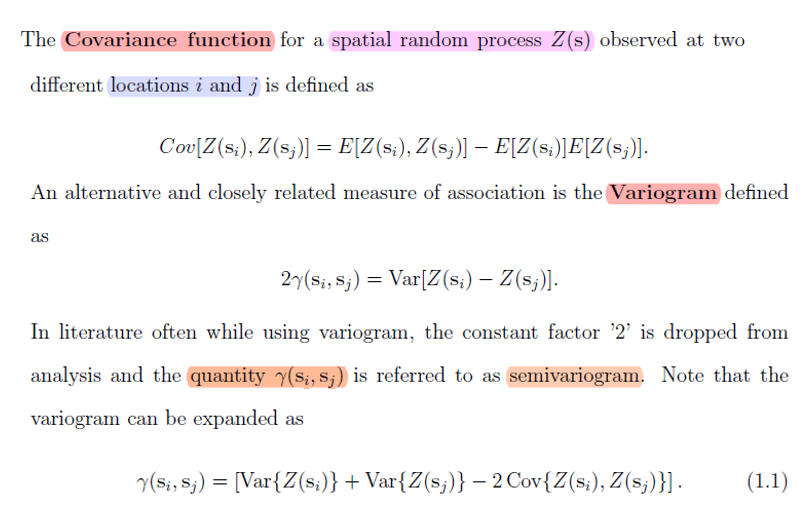
But I am not sure how to implement the key variogram function in the Wolfram Language.
My main problem is that is something like a "moving variance" equivalent of "moving average" and when I shift the Z[s] function to Z[s+h] ("h" is the "lag distance") I inmediately go outside the domain of the "s" variable (a bounded region, like a finite distance in space or a finite interval of time), and so I must drop the "outside domain" elements from the data to get a valid result.
In the Wolfram Language there is of course the "CovarianceFunction" that can do that (for covariance). But what about the cited "variogram" function? How to define a "moving variance", so it can be calculated in different locations of a domain?
If I write:
Variance[Z[s]-Z[s+h]];
With:
sMIN<=s<=sMAX
When I put s+h I would get outside the required interval for some data, that must be dropped to get a meaningful result.
Your help will be greatly appreciated. Most computer codes that do that are cryptic "black boxes" and also very expensive.
Best regards,
Alberto Silva Ariano


