Hello i am trying to plot a function using Plot3D
ClearAll["Global`*"];
M0 = 1;
M = 3;
\[Beta] = Sqrt[(\[Sigma]^2 + M^2)/M0];
ucap[\[Beta]_, r_] := (
  3 \[Beta]^2 ((1 + r \[Beta]^2) BesselI[0,
       2 \[Beta]] - (1 + \[Beta]^2) BesselI[0,
       2 Sqrt[r] \[Beta]]))/((6 + 9 \[Beta]^2 + 2 \[Beta]^4) BesselI[
     0, 2 \[Beta]] -
   6 (1 + \[Beta]^2)^2 Hypergeometric0F1Regularized[2, \[Beta]^2]);
Table[
 Plot3D[
  ucap[\[Beta], r] /. {r -> Norm[{x, y}]}, {x, -1, 1}, {y, -1, 1},
  RegionFunction -> (Norm[{#, #2}] <= 1 &),
  ImageSize -> Large,
  AxesLabel -> {"Axial velocity"},
  PlotStyle -> Thick
  ],
 {\[Sigma], {1, 5, 30, 100}}
 ]
Here is one sample from an article
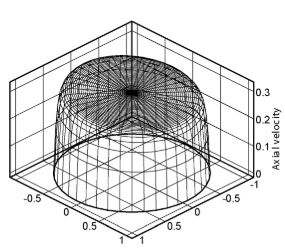 .
.
I also want to show the function in animation form for sigma values 0 to 100. Please Help


