I've been trying to fit a function to the data below:
pp = {0.01`, 0.010707070707070708`, 0.011414141414141415`,
   0.012121212121212121`, 0.01282828282828283`, 0.013535353535353538`,
    0.014242424242424246`, 0.01494949494949495`,
   0.015656565656565657`, 0.016363636363636365`,
   0.017070707070707073`, 0.017777777777777778`,
   0.018484848484848486`, 0.019191919191919194`,
   0.019898989898989902`, 0.020606060606060607`, 0.02131313131313132`,
    0.022020202020202023`, 0.022727272727272728`,
   0.02343434343434344`, 0.024141414141414144`, 0.02484848484848485`,
   0.02555555555555556`, 0.026262626262626265`, 0.02696969696969697`,
   0.02767676767676768`, 0.028383838383838386`, 0.02909090909090909`,
   0.029797979797979803`, 0.030505050505050507`,
   0.031212121212121212`, 0.031919191919191924`, 0.03262626262626263`,
    0.03333333333333334`, 0.034040404040404044`,
   0.034747474747474756`, 0.035454545454545454`,
   0.036161616161616165`, 0.03686868686868687`, 0.03757575757575758`,
   0.038282828282828286`, 0.038989898989899`, 0.039696969696969696`,
   0.04040404040404041`, 0.04111111111111112`, 0.04181818181818183`,
   0.04252525252525253`, 0.04323232323232324`, 0.04393939393939394`,
   0.04464646464646465`, 0.04535353535353536`, 0.04606060606060607`,
   0.04676767676767677`, 0.04747474747474748`, 0.048181818181818194`,
   0.0488888888888889`, 0.0495959595959596`, 0.050303030303030315`,
   0.05101010101010101`, 0.051717171717171724`, 0.05242424242424242`,
   0.05313131313131313`, 0.053838383838383845`, 0.05454545454545456`,
   0.055252525252525254`, 0.055959595959595966`, 0.05666666666666668`,
    0.05737373737373738`, 0.05808080808080809`, 0.0587878787878788`,
   0.0594949494949495`, 0.06020202020202021`, 0.060909090909090906`,
   0.06161616161616162`, 0.06232323232323233`, 0.06303030303030303`,
   0.06373737373737375`, 0.06444444444444444`, 0.06515151515151515`,
   0.06585858585858587`, 0.06656565656565658`, 0.06727272727272728`,
   0.06797979797979799`, 0.0686868686868687`, 0.0693939393939394`,
   0.07010101010101011`, 0.0708080808080808`, 0.07151515151515152`,
   0.07222222222222223`, 0.07292929292929293`, 0.07363636363636364`,
   0.07434343434343435`, 0.07505050505050506`, 0.07575757575757576`,
   0.07646464646464647`, 0.07717171717171718`, 0.07787878787878788`,
   0.07858585858585859`, 0.07929292929292929`, 0.08`,
   0.08000100000000002`, 0.08020301010101011`, 0.08040502020202021`,
   0.08060703030303032`, 0.08080904040404041`, 0.08101105050505052`,
   0.08121306060606062`, 0.0814150707070707`, 0.08161708080808083`,
   0.08181909090909091`, 0.08202110101010102`, 0.08222311111111112`,
   0.08242512121212123`, 0.08262713131313133`, 0.08282914141414141`,
   0.08303115151515152`, 0.08323316161616162`, 0.08343517171717173`,
   0.08363718181818183`, 0.08383919191919192`, 0.08404120202020203`,
   0.08424321212121214`, 0.08444522222222223`, 0.08464723232323233`,
   0.08484924242424244`, 0.08505125252525253`, 0.08525326262626264`,
   0.08545527272727274`, 0.08565728282828285`, 0.08585929292929295`,
   0.08606130303030303`, 0.08626331313131314`, 0.08646532323232324`,
   0.08666733333333335`, 0.08686934343434345`, 0.08707135353535353`,
   0.08727336363636364`, 0.08747537373737374`, 0.08767738383838385`,
   0.08787939393939395`, 0.08808140404040404`, 0.08828341414141416`,
   0.08848542424242425`, 0.08868743434343435`, 0.08888944444444445`,
   0.08909145454545454`, 0.08929346464646466`, 0.08949547474747475`,
   0.08969748484848487`, 0.08989949494949497`, 0.09010150505050507`,
   0.09030351515151516`, 0.09050552525252525`, 0.09070753535353537`,
   0.09090954545454547`, 0.09111155555555557`, 0.09131356565656568`,
   0.09151557575757575`, 0.09171758585858587`, 0.09191959595959596`,
   0.09212160606060607`, 0.09232361616161618`, 0.09252562626262628`,
   0.09272763636363639`, 0.09292964646464646`, 0.09313165656565657`,
   0.09333366666666668`, 0.09353567676767678`, 0.09373768686868689`,
   0.09393969696969698`, 0.09414170707070708`, 0.09434371717171718`,
   0.09454572727272728`, 0.09474773737373739`, 0.09494974747474748`,
   0.09515175757575758`, 0.09535376767676769`, 0.0955557777777778`,
   0.0957577878787879`, 0.09595979797979799`, 0.09616180808080808`,
   0.09636381818181819`, 0.09656582828282831`, 0.0967678383838384`,
   0.0969698484848485`, 0.09717185858585858`, 0.09737386868686869`,
   0.09757587878787881`, 0.0977778888888889`, 0.097979898989899`,
   0.0981819090909091`, 0.09838391919191919`, 0.09858592929292932`,
   0.0987879393939394`, 0.0989899494949495`, 0.09919195959595961`,
   0.09939396969696972`, 0.09959597979797982`, 0.09979798989898991`,
   0.1`};

ContactStress = {83.14596642908006`, 77.58716537499181`,
   72.72347179004971`, 68.4328877284667`, 64.62036843796453`,
   61.21077271109077`, 58.1439152811391`, 55.37102476454469`,
   52.8521624506873`, 50.55431106430899`, 48.44993907622229`,
   46.51590804524197`, 44.7326310548189`, 43.08341742612961`,
   41.553957329372395`, 40.1319126559514`, 38.80658944988966`,
   37.56867354706694`, 36.41001564257737`, 35.32345533560129`,
   34.302676152232024`, 33.34208536942998`, 32.436713832026854`,
   31.582131990768772`, 30.77437918261592`, 30.00990290782405`,
   29.285512331013468`, 28.598326107106683`, 27.945743913827734`,
   27.32541006461534`, 26.735186748778997`, 26.173130097170798`,
   25.63746938821645`, 25.126588927908035`, 24.639012227006305`,
   24.17338800432694`, 23.72847833563175`, 23.30314816774542`,
   22.896354280631968`, 22.507139079571317`, 22.13462208646454`,
   21.77799362097478`, 21.43650906581671`, 21.10948377763758`,
   20.79628858052413`, 20.49634579504829`, 20.209125743496816`,
   19.93414368805863`, 19.67095716497544`, 19.41916368418391`,
   19.178398769926538`, 18.948334323304387`, 18.728677292965198`,
   18.519168645189307`, 18.319582629689748`, 18.129726342643906`,
   17.94943959396884`, 17.778595091822336`, 17.61709896398073`,
   17.46489164332841`, 17.32194915357833`, 17.188284841796122`,
   17.06395161693782`, 16.949044768962914`, 16.843705462012508`,
   16.74812501869048`, 16.662550142057306`, 16.58728925940608`,
   16.52272021974776`, 16.469299638577507`, 16.427574263575217`,
   16.39819483982539`, 16.381933091864024`, 16.379702624995414`,
   16.39258479783216`, 16.421860957861174`, 16.469052899915006`,
   16.53597405992931`, 16.624794877762884`, 16.738127082232687`,
   16.87913356956213`, 17.051673381059835`, 17.26049555100994`,
   17.51150214142692`, 17.812111046838638`, 18.171765648292357`,
   18.602665624901366`, 19.1208395576388`, 19.74776152362708`,
   20.512863209676272`, 21.457579094055294`, 22.64213971677775`,
   24.15756909551329`, 26.148218165719694`, 28.857479716539217`,
   32.73026522729564`, 38.67592384075037`, 48.888135215514296`,
   70.34960876281495`, 143.60209487025304`, 143.830710737466`,
   214.3484327861083`,
   440.2078996235133`, -4256.681805202328`, -349.45567703990736`, \
-178.0586433574872`, -117.5504170065206`, -86.62959085359495`, \
-67.86361398939319`, -55.26655746848648`, -46.22876001891658`, \
-39.43059289912834`, -34.133009316192094`, -29.889893269592715`, \
-26.416010853293596`, -23.520484808869078`, -21.07075789938404`, \
-18.971899972049037`, -17.154141863054953`, -15.565057427807853`, \
-14.16449003905459`, -12.92116167378771`, -11.810347667569108`, \
-10.812245856339217`, -9.91080965030734`, -9.092898038387977`, \
-8.347646449397299`, -7.665994298833418`, -7.040325509743461`, \
-6.464191698540589`, -5.932096666738032`, -5.43932692216949`, \
-4.981817154194964`, -4.556042531819557`, -4.158931785833076`, \
-3.7877965414553607`, -3.440273463965812`, -3.114276586467024`, \
-2.807957788665662`, -2.5196738457905314`, -2.2479588077129358`, \
-1.9915007287709865`, -1.7491219692201445`, -1.51976244471499`, \
-1.3024653216220792`, -1.09636475140948`, -0.9006753128872176`, \
-0.7146828911461252`, -0.5377367701779886`, -0.3692427548421839`, \
-0.20865716917989344`, -0.05548160351110482`, 0.0907416964499454`,
   0.23043388817879393`, 0.3639831142974669`, 0.4917476719499555`,
   0.6140588239936031`, 0.7312232983599432`, 0.8435255152094023`,
   0.9512295758424297`, 1.054581042587206`, 1.1538085348440918`,
   1.2491251630685924`, 1.3407298195706239`, 1.4288083425345932`,
   1.5135345675561018`, 1.595071279172163`, 1.6735710733097195`,
   1.749177140231576`, 1.822023976400054`, 1.8922380326753288`,
   1.9599383053927848`, 2.025236876107117`, 2.0882394051296025`,
   2.1490455834091846`, 2.207749546799718`, 2.2644402563190167`,
   2.319201847610348`, 2.3721139524784274`, 2.4232519950680533`,
   2.4726874649891233`, 2.520488169453898`, 2.566718466283343`,
   2.6114394794563207`, 2.654709298706944`, 2.696583164531228`,
   2.737113639832705`, 2.776350769316922`, 2.8143422276470442`,
   2.8511334572690483`, 2.8867677967411796`, 2.9212866003204034`,
   2.954729349492396`, 2.9871337570726104`, 3.018535864447475`,
   3.0489701324793943`, 3.078469526549617`, 3.1070655961769216`,
   3.1347885496105996`, 3.1616673237641475`};
I used the following code for the fitting:
Data = Table[{pp[[ii]], ContactStress[[ii]]}, {ii, 200}];
PlotData =
  ListLinePlot[Data, PlotJoined -> True, PlotStyle -> {Red, Thick}];
(*-----------------------------------------------------------------------------\
*)
(*----------------------FİTTİNG---------------------------------------------\
*)

fitData = Fit[GraphLaplaceP, {1, p^-1, p^-2, p^-2 Log[p^2]}, p];

PlotfitData =
  Plot[fitData, {p, pp[[1]], pp[[200 ]]}, PlotRange -> All,
   Mesh -> 50];
Show[PlotData, PlotfitData]
I got the below fit:
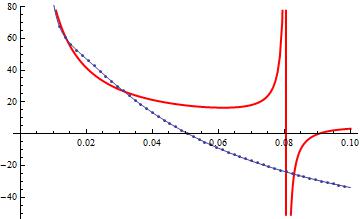
I am wondering how to improve this fit. Thank you all for help!
 Attachments:


