In most standard complex analysis notebooks, you will see diagrams illustrating how a particular section of the complex plane is mapped to another by a function.
A number of examples are given at
https://mathworld.wolfram.com/ConformalMapping.html
but I felt that there was a good opportunity to make a more general function to illustrate these maps, and created a ResourceFunction called ComplexMapVisualization.
This function is built around ImageTransformation, and, with default options, takes a function and illustrates how it maps a given section of the complex plane:
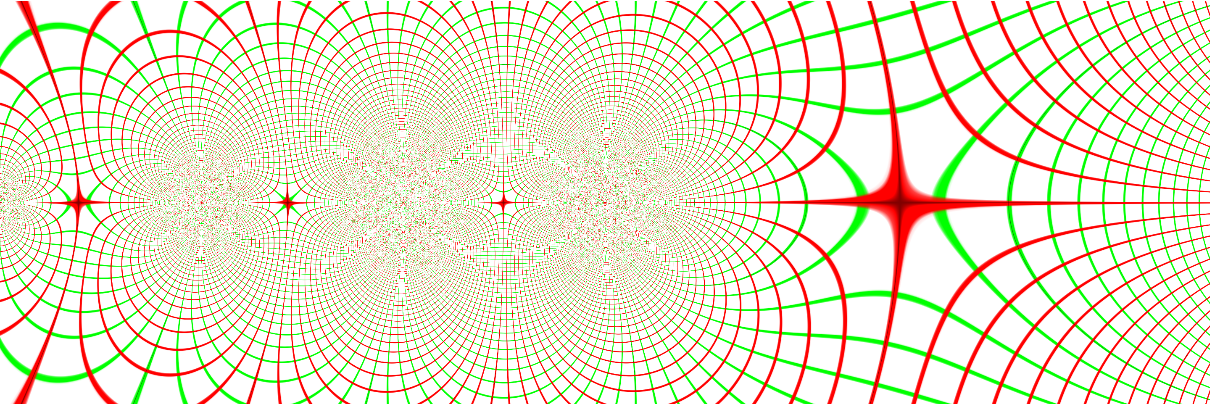
ResourceFunction["ComplexMapVisualization"][Gamma, PlotRange -> {{-3, 3}, {-1, 1}}]
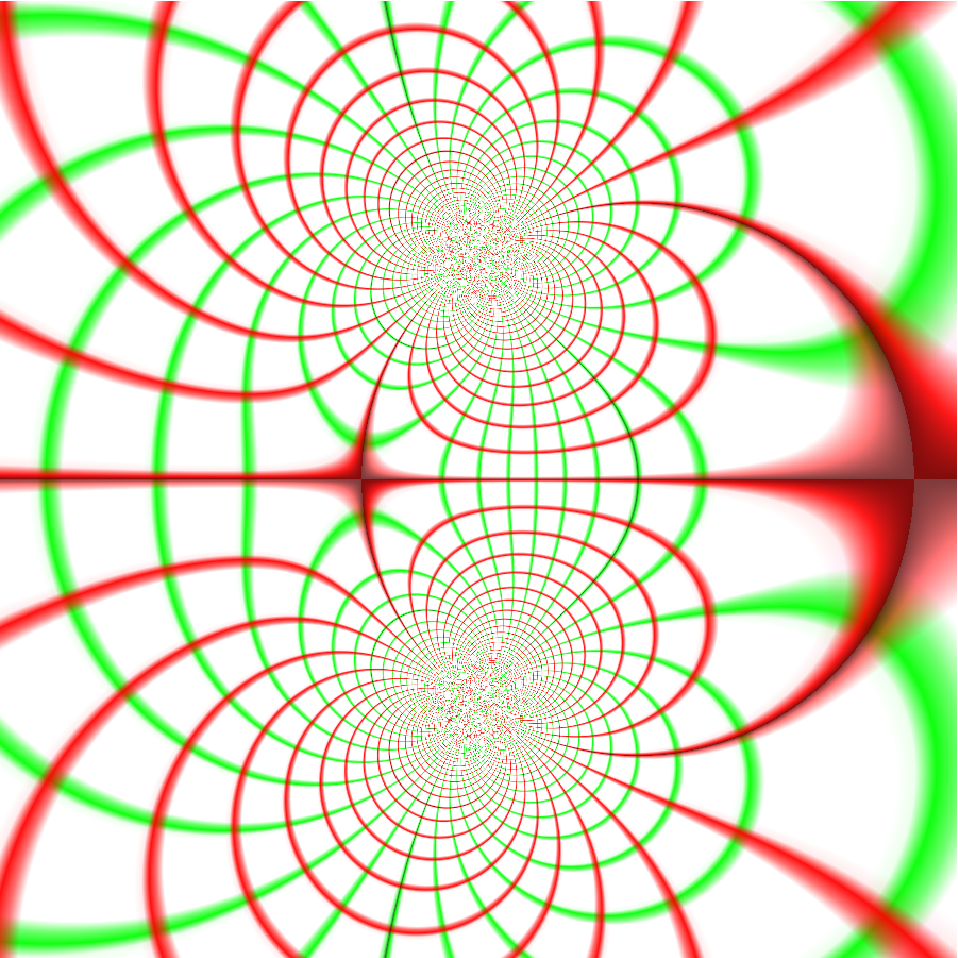
ResourceFunction["ComplexMapVisualization"][
 Function[z, (z - 1)/(z^2 + 2)], PlotRange -> {{-3, 3}, {-3, 3}}, RasterSize -> 150]
The function is built around ImageTransformation and Rasterize, and inherits options from both of those. You can also specify your own image to visualize the map:
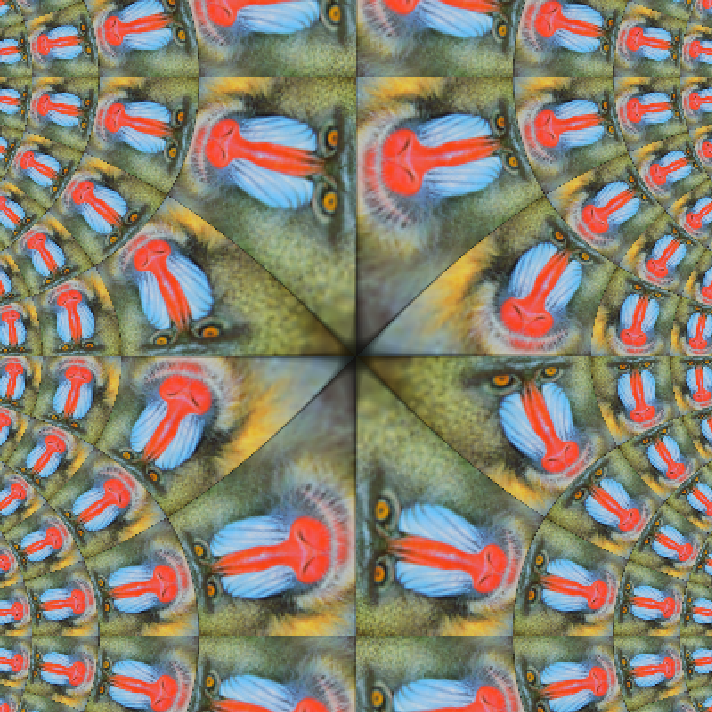
ResourceFunction["ComplexMapVisualization"][Cosh, PlotRange -> {{-2, 2}, {-2, 2}}, "Image" -> ExampleData[{"TestImage", "Mandrill"}], RasterSize -> 100]
Enjoy!


