Message Boards Message Boards

0
|
1854 Views
|
3 Replies
|
0 Total Likes
View groups...
Share
Share this post:

[Solved] How to position an arrow with epilog on a ListLinePlot?

Posted 1 year ago

I'd like the Red arrow below to coincide with the points of the Black line. How is this done? I've been working on it for awhile but can't seem to pin the tail on the donkey!

plotData = {};
line1Points = {{1, 4}, {10, 4}};
AppendTo[plotData, {line1Points, RGBColor["RoyalBlue"]}];
line2Points = {{1, 5}, {10, 5}};
AppendTo[plotData, {line2Points, RGBColor["RoyalBlue"]}];

arrowPoints = {{7, 4.5}, {7 - Cos[Pi/4], 3.5 + Sin[Pi/4]}, {6, 3.5}};
AppendTo[plotData, {arrowPoints, Black}];

xRange = {-1, 11};
yRange = {-1, 7};

gPlot = ListLinePlot[
   plotData[[;; , 1]],
   PlotStyle -> plotData[[;; , 2]],
   Axes -> None,
   PlotMarkers -> None,
   PlotRange -> {xRange, yRange},
   PlotRangeClipping -> False,
   AspectRatio -> ((yRange[[2]] - yRange[[1]])/(xRange[[2]] - 
        xRange[[1]])),
   ImageSize -> {72*4.5, Automatic},
   Epilog -> {Inset[
      Graphics[{Red, Arrowheads[0.3], 
        Arrow[BezierCurve[Scaled[#] & /@ arrowPoints]]}]]}
   ];
Print[gPlot];
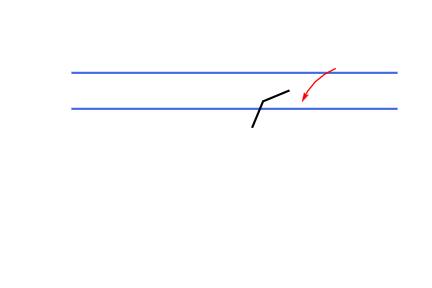
enter image description here

POSTED BY: Richard Frost
3 Replies

Hi Gianluca - good to hear from you. Thank you for the suggestion to use Graphics directly. I solved the problem by using Show:

gPlot = Show[
   ListLinePlot[
    plotData[[;; , 1]],
    AxesOrigin -> {0., 0.},
    PlotStyle -> plotData[[;; , 2]],
    Axes -> None,
    PlotMarkers -> None,
    PlotRange -> {xRange, yRange},
    PlotRangeClipping -> False,
    AspectRatio -> ((yRange[[2]] - yRange[[1]])/(xRange[[2]] - 
         xRange[[1]])),
    ImageSize -> {72*4.5, Automatic}
    ],
   Graphics[{Red, Arrowheads[0.03], Arrow[BezierCurve[arrowPoints]]}]
   ];

enter image description here

POSTED BY: Richard Frost

I don't know what you are trying to achieve, but this may be helpful:

line1Points = {{1, 4}, {10, 4}};
line2Points = {{1, 5}, {10, 5}};
xRange = {-1, 11};
yRange = {-1, 7};
arrowPoints = {{7, 4.5}, {7 - Cos[Pi/4], 3.5 + Sin[Pi/4]}, {6, 3.5}};
Graphics[{RGBColor["RoyalBlue"],
  Line[{line1Points, line2Points}],
  Red, Arrowheads[0.05],
  Arrow[BezierCurve[arrowPoints]]},
 PlotRange -> {xRange, yRange},
 AspectRatio -> Automatic]
POSTED BY: Gianluca Gorni

The scaled coordinates range from 0 to 1. Your arrowPoints are all outside of the bounds.

POSTED BY: Gianluca Gorni
Reply to this discussion
Community posts can be styled and formatted using the Markdown syntax.
Reply Preview
Attachments
Remove
or Discard

Group Abstract Group Abstract