Group Abstract Group Abstract

Message Boards Message Boards

0
|
3.2K Views
|
4 Replies
|
0 Total Likes
View groups...
Share
Share this post:

How to place equally spaced PlotMarkers in a plot?

Posted 3 years ago

Hello, I want the Markers to be eaually spaced. Here is my code

ClearAll["Global`*"];
\[Sigma] = 20;
Kn = {0, 0.025, 0.05, 0.1};
Subscript[\[Sigma], v] = 0.85;
Subscript[\[Alpha], v] = (2 - Subscript[\[Sigma], v])/
  Subscript[\[Sigma], v];
\[Alpha] = Subscript[\[Alpha], v] Kn;
u = (\[Sigma] (BesselI[0, \[Sigma]] - 
     BesselI[0, 
      r \[Sigma]] + \[Alpha] \[Sigma] BesselI[
       1, \[Sigma]]))/(\[Sigma] BesselI[
     0, \[Sigma]] + (-2 + \[Alpha] \[Sigma]^2) BesselI[1, \[Sigma]]);
u1[r_] := (BesselI[0, \[Sigma]] - BesselI[0, r \[Sigma]])/
  BesselI[2, \[Sigma]];
data = Table[{r, u1[r]}, {r, 0, 1, 0.01}];
Vslip = Plot[
   u, {r, 0, 1},
   PlotRange -> {{0, Automatic}, {0, Automatic}},
   AxesOrigin -> {0, 0},
   LabelStyle -> {FontFamily -> "Times New Roman", 24, Bold},
   PlotLegends -> Placed[{Style["\!\(\*
StyleBox[\"Kn\",\nFontSlant->\"Italic\"]\)=0", {Bold, 20}], 
      Style["\!\(\*
StyleBox[\"Kn\",\nFontSlant->\"Italic\"]\)=0.025", 20], Style["\!\(\*
StyleBox[\"Kn\",\nFontSlant->\"Italic\"]\)=0.05", 20], Style["\!\(\*
StyleBox[\"Kn\",\nFontSlant->\"Italic\"]\)=0.1", 20]}, {Left, Bottom}],
   PlotStyle -> {{Black, Thick}, {Blue, Thick}, {Red, Thick}, {Green, 
      Thick}, {Orange, Thick}}
   ];
Vnoslip = ListPlot[data,
   PlotMarkers -> {"\[EmptySquare]", 24},
   AxesOrigin -> {0, 0},
   PlotRange -> {{0, Automatic}, {0, Automatic}},
   LabelStyle -> {FontFamily -> "Times New Roman", 24, Bold},
   PlotLegends -> {Placed[{Style["\!\(\*
StyleBox[\"Kn\",\nFontSlant->\"Italic\"]\)=0 (Sharma et al.[])", \
{Bold, 20}]}, {Left, Bottom}], Placed[Style[Framed["\!\(\*
StyleBox[\"\[Sigma]\",\nFontSlant->\"Italic\"]\)=1", 
        RoundingRadius -> 5], {Bold, 20}], {Center, Bottom}]},
   PlotStyle -> {Black, Thick}
   ];
Show[Vnoslip, Vslip,
 ImageSize -> Large,
 AxesStyle -> {Black, Black},
 AxesLabel -> {r, "\!\(\*OverscriptBox[\(u\), \(^\)]\)"},
 PlotLabel -> Style["(a)", 24, Black]
 ]

enter image description here

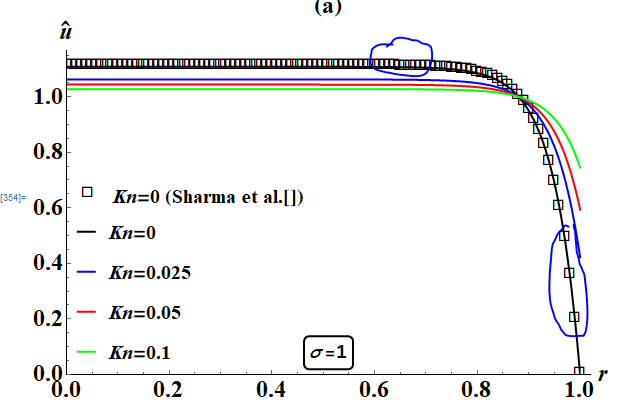
Plot markers are unequally space as depicted in fig above.

POSTED BY: KRISHAN SHARMA
4 Replies

I don't know if there's an easy way. I assume you want the markers evenly spaced in the scaled coordinate system of the displayed plot. The units in the x and y directions are not equal, so the apparent distance is not the true distance. I'm also assuming the markers are not to mark data but to help identify the curve in the plot.

Here are two ways:

(1) The mesh function ArcLength gives mesh points evenly spaced by arc length. You need to scale the coordinate system to get "evenly spaced" to mean even spaced in screen coordinates. It takes a few steps to calculate the appropriate scaling, including a trial calculation of the plot. The we'll map the Point objects generated by Mesh to the desired marker.

plot = Plot[(BesselI[0, 20] - BesselI[0, 20 r])/BesselI[2, 20], {r, 0, 1}];
aspectRatio = AspectRatio /. AbsoluteOptions[plot, AspectRatio];
scalingfactor = 
  aspectRatio/Ratios[Differences /@ PlotRange[plot]][[1, 1]];
plot = Plot[(BesselI[0, 20] - BesselI[0, 20 r])/BesselI[2, 20], {r, 0, 1},
   MeshFunctions -> {ArcLength}, Mesh -> 15, 
   ScalingFunctions -> {scalingfactor # &, #/scalingfactor &}];
Normal@plot /. 
 Point -> (GeometricTransformation[
     Inset[Style["\[EmptySquare]", FontSize -> 24], {0., 0.}], #] &)

You can add markers at the end point by hand with Show, if they are desired. A simple way:

Graphics[{
  GeometricTransformation[
         Inset[Style["\[EmptySquare]", FontSize -> 24], {0., 0.}], {0., u1[0.]}],
  GeometricTransformation[
         Inset[Style["\[EmptySquare]", FontSize -> 24], {0., 0.}], {1., u1[1.]}] 
 }]

(2) The function ```will take care of thePlotRange` part of the scaling above, but you still have to adjust for the aspect ratio:

aspectRatio = AspectRatio /. Options[ListLinePlot, AspectRatio];
Show[ListLinePlot[data],
 Graphics[{
   GeometricTransformation[
    Inset[Style["\[EmptySquare]", FontSize -> 24], {0., 0.}],
    GraphUtilities`LineScaledCoordinate[
        data . DiagonalMatrix[{1, aspectRatio}], #] . 
       DiagonalMatrix[{1, 1/aspectRatio}] & /@ Subdivide[0., 1., 16]]
   }],
 AspectRatio -> aspectRatio
 ]
POSTED BY: Michael Rogers
Posted 3 years ago

As far as I can tell from the documentation, you won't be able to do this with PlotMarkers. That option seems specific to the ListPlot family of plotting methods and it always places markers at the values in the data being plotted.

An alternative might be to use Plot. You can interpolate your data and use PlotStyle.

fn = Interpolation[data];
Plot[fn[x], {x, 0, 1}, PlotStyle -> {Black, Dashed}]

Of course, you wanted little squares, not dashing, but I thought this might be acceptable. If not, then I don't know how to use PlotStyle (or some other option) to automatically place markers. You could generate the graphical markers explicitly yourself (maybe using the interpolation to place them evenly) and add them to your Show expression.

POSTED BY: Eric Rimbey
Posted 3 years ago

Thanks, I think using Dot in place of Dashed in PlotStyle can work. Only the size and spacing between the Dots if we able to manage. Is there any way to increases the spacing between the dots?

POSTED BY: KRISHAN SHARMA
Posted 3 years ago

Using AbsoluteDashing in place of Dashed is working.

POSTED BY: KRISHAN SHARMA
Reply to this discussion
Community posts can be styled and formatted using the Markdown syntax.
Reply Preview
Attachments
Remove
or Discard